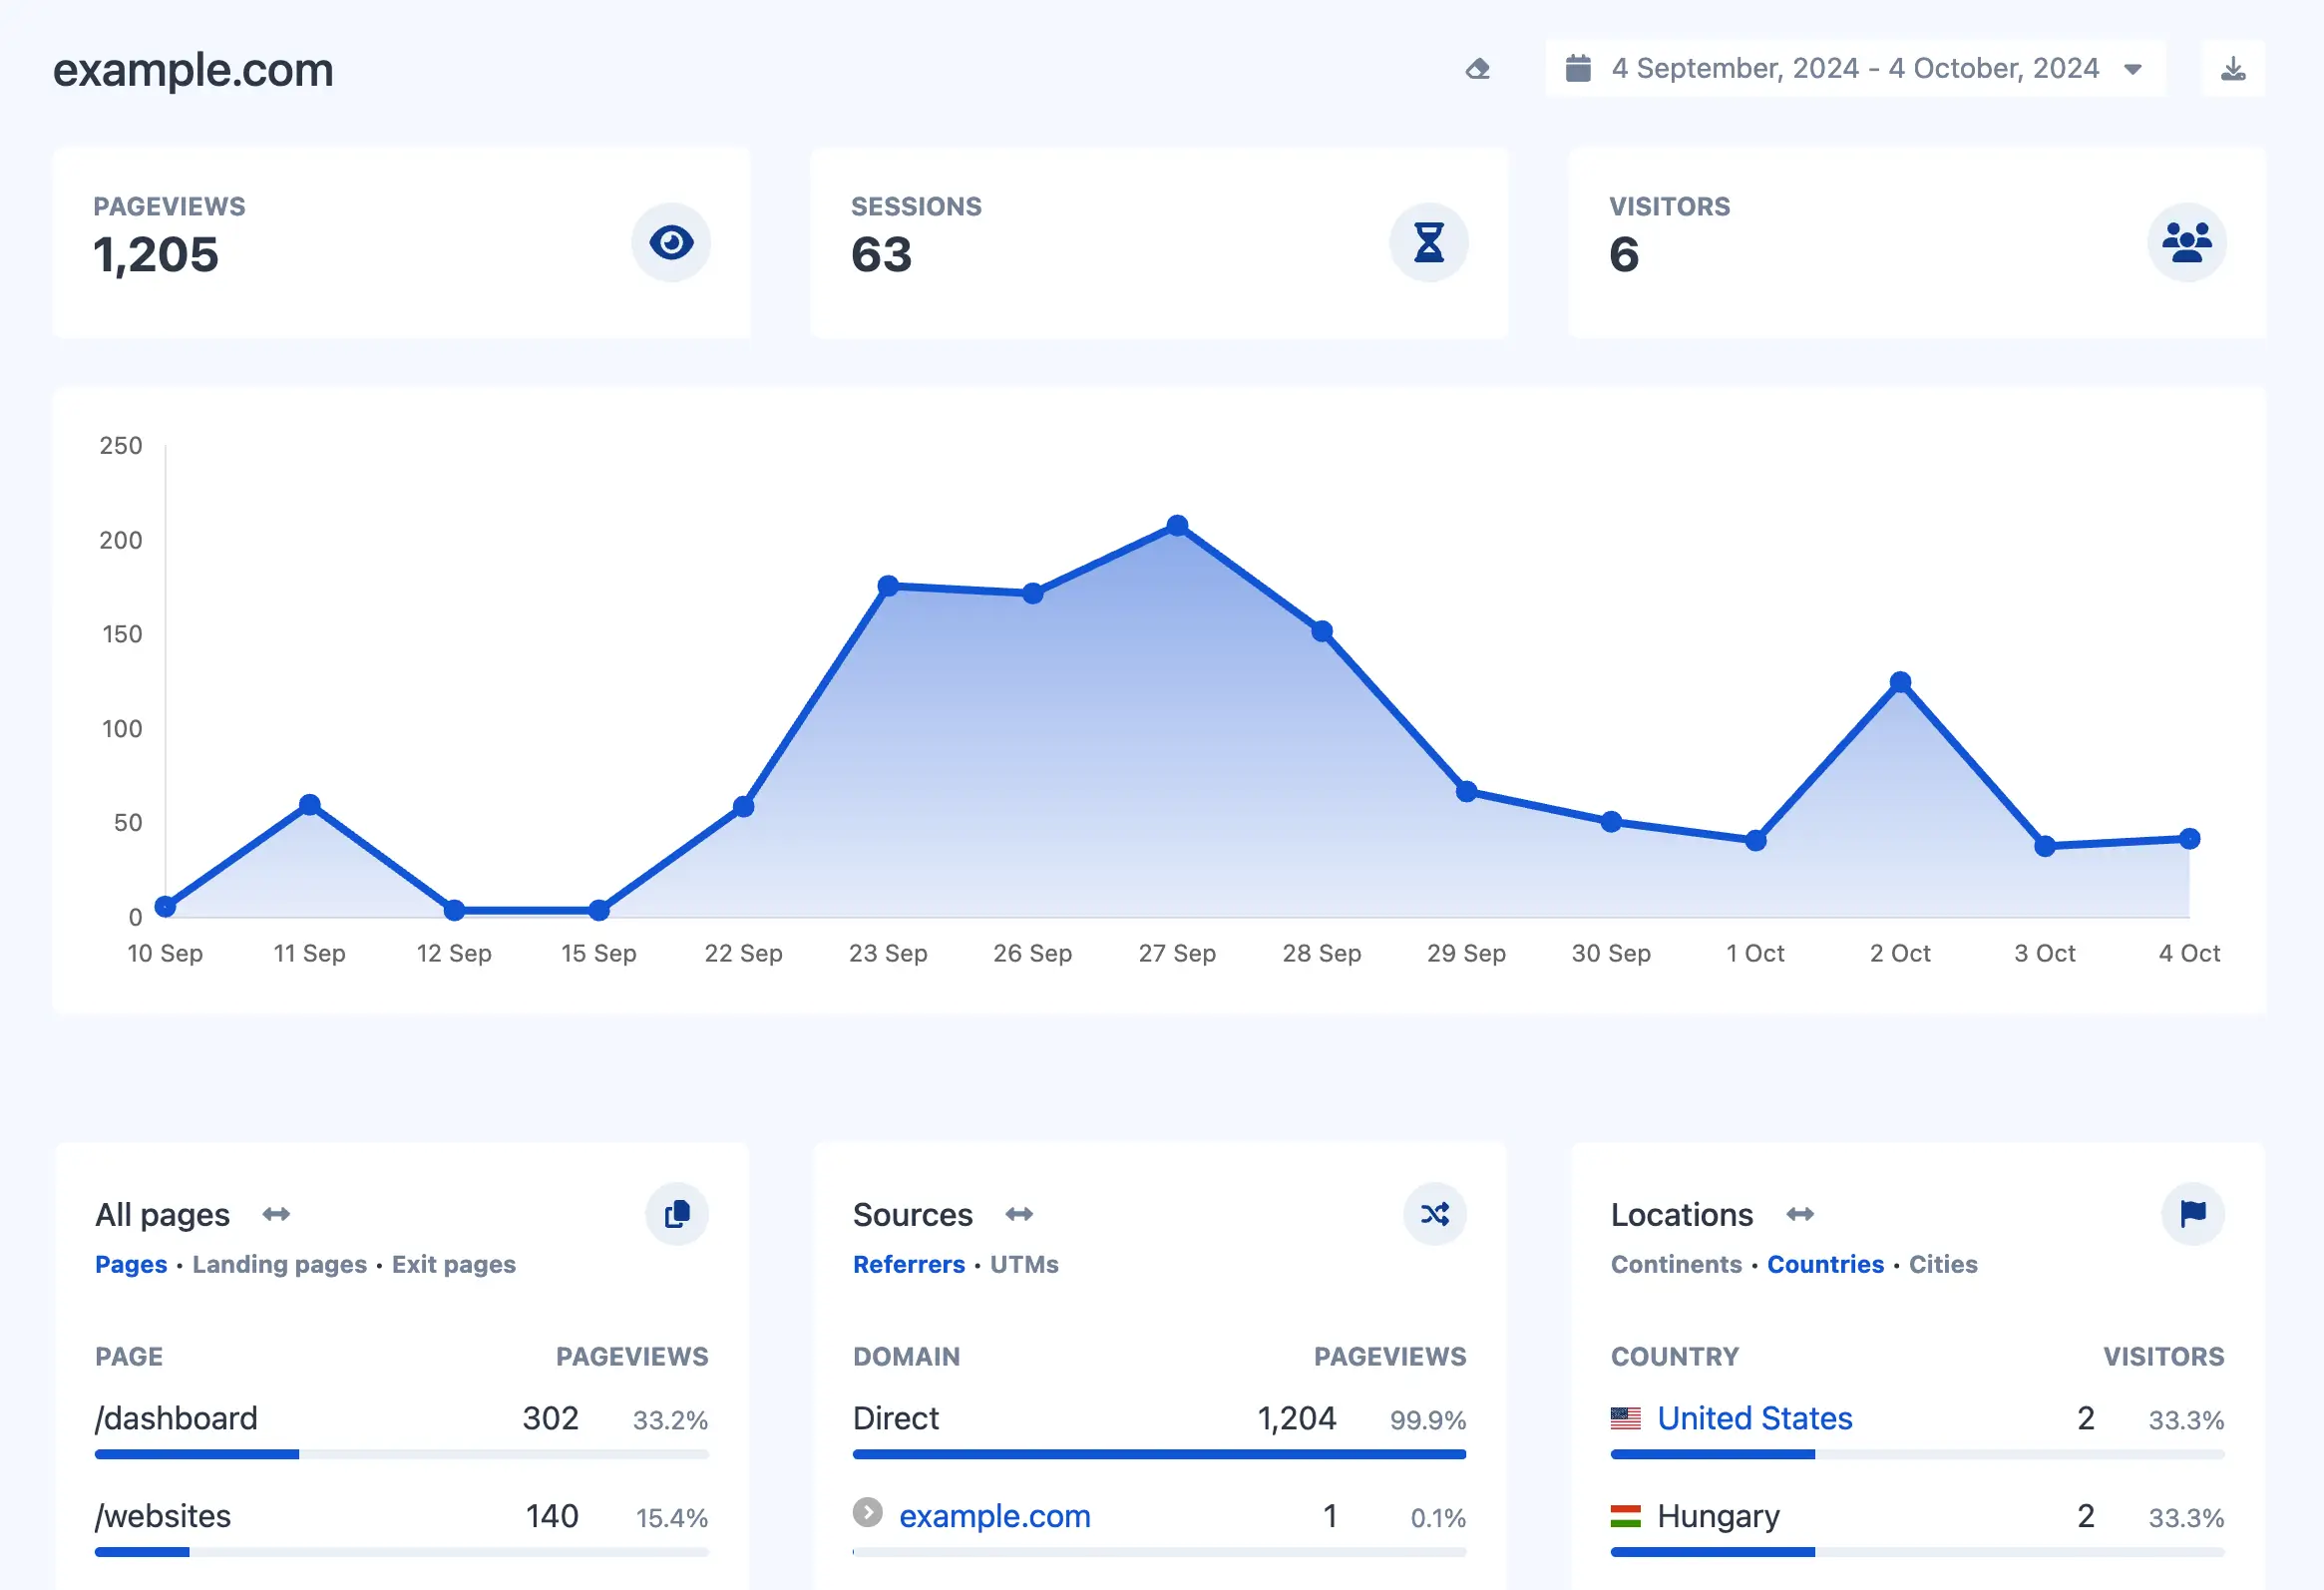
All-in-one web analytics.
Easy and friendly analytics. Track your users journey, replay sessions, collect heatmaps & more.
Tracking modes
We respect your data
Private, safe & compliant
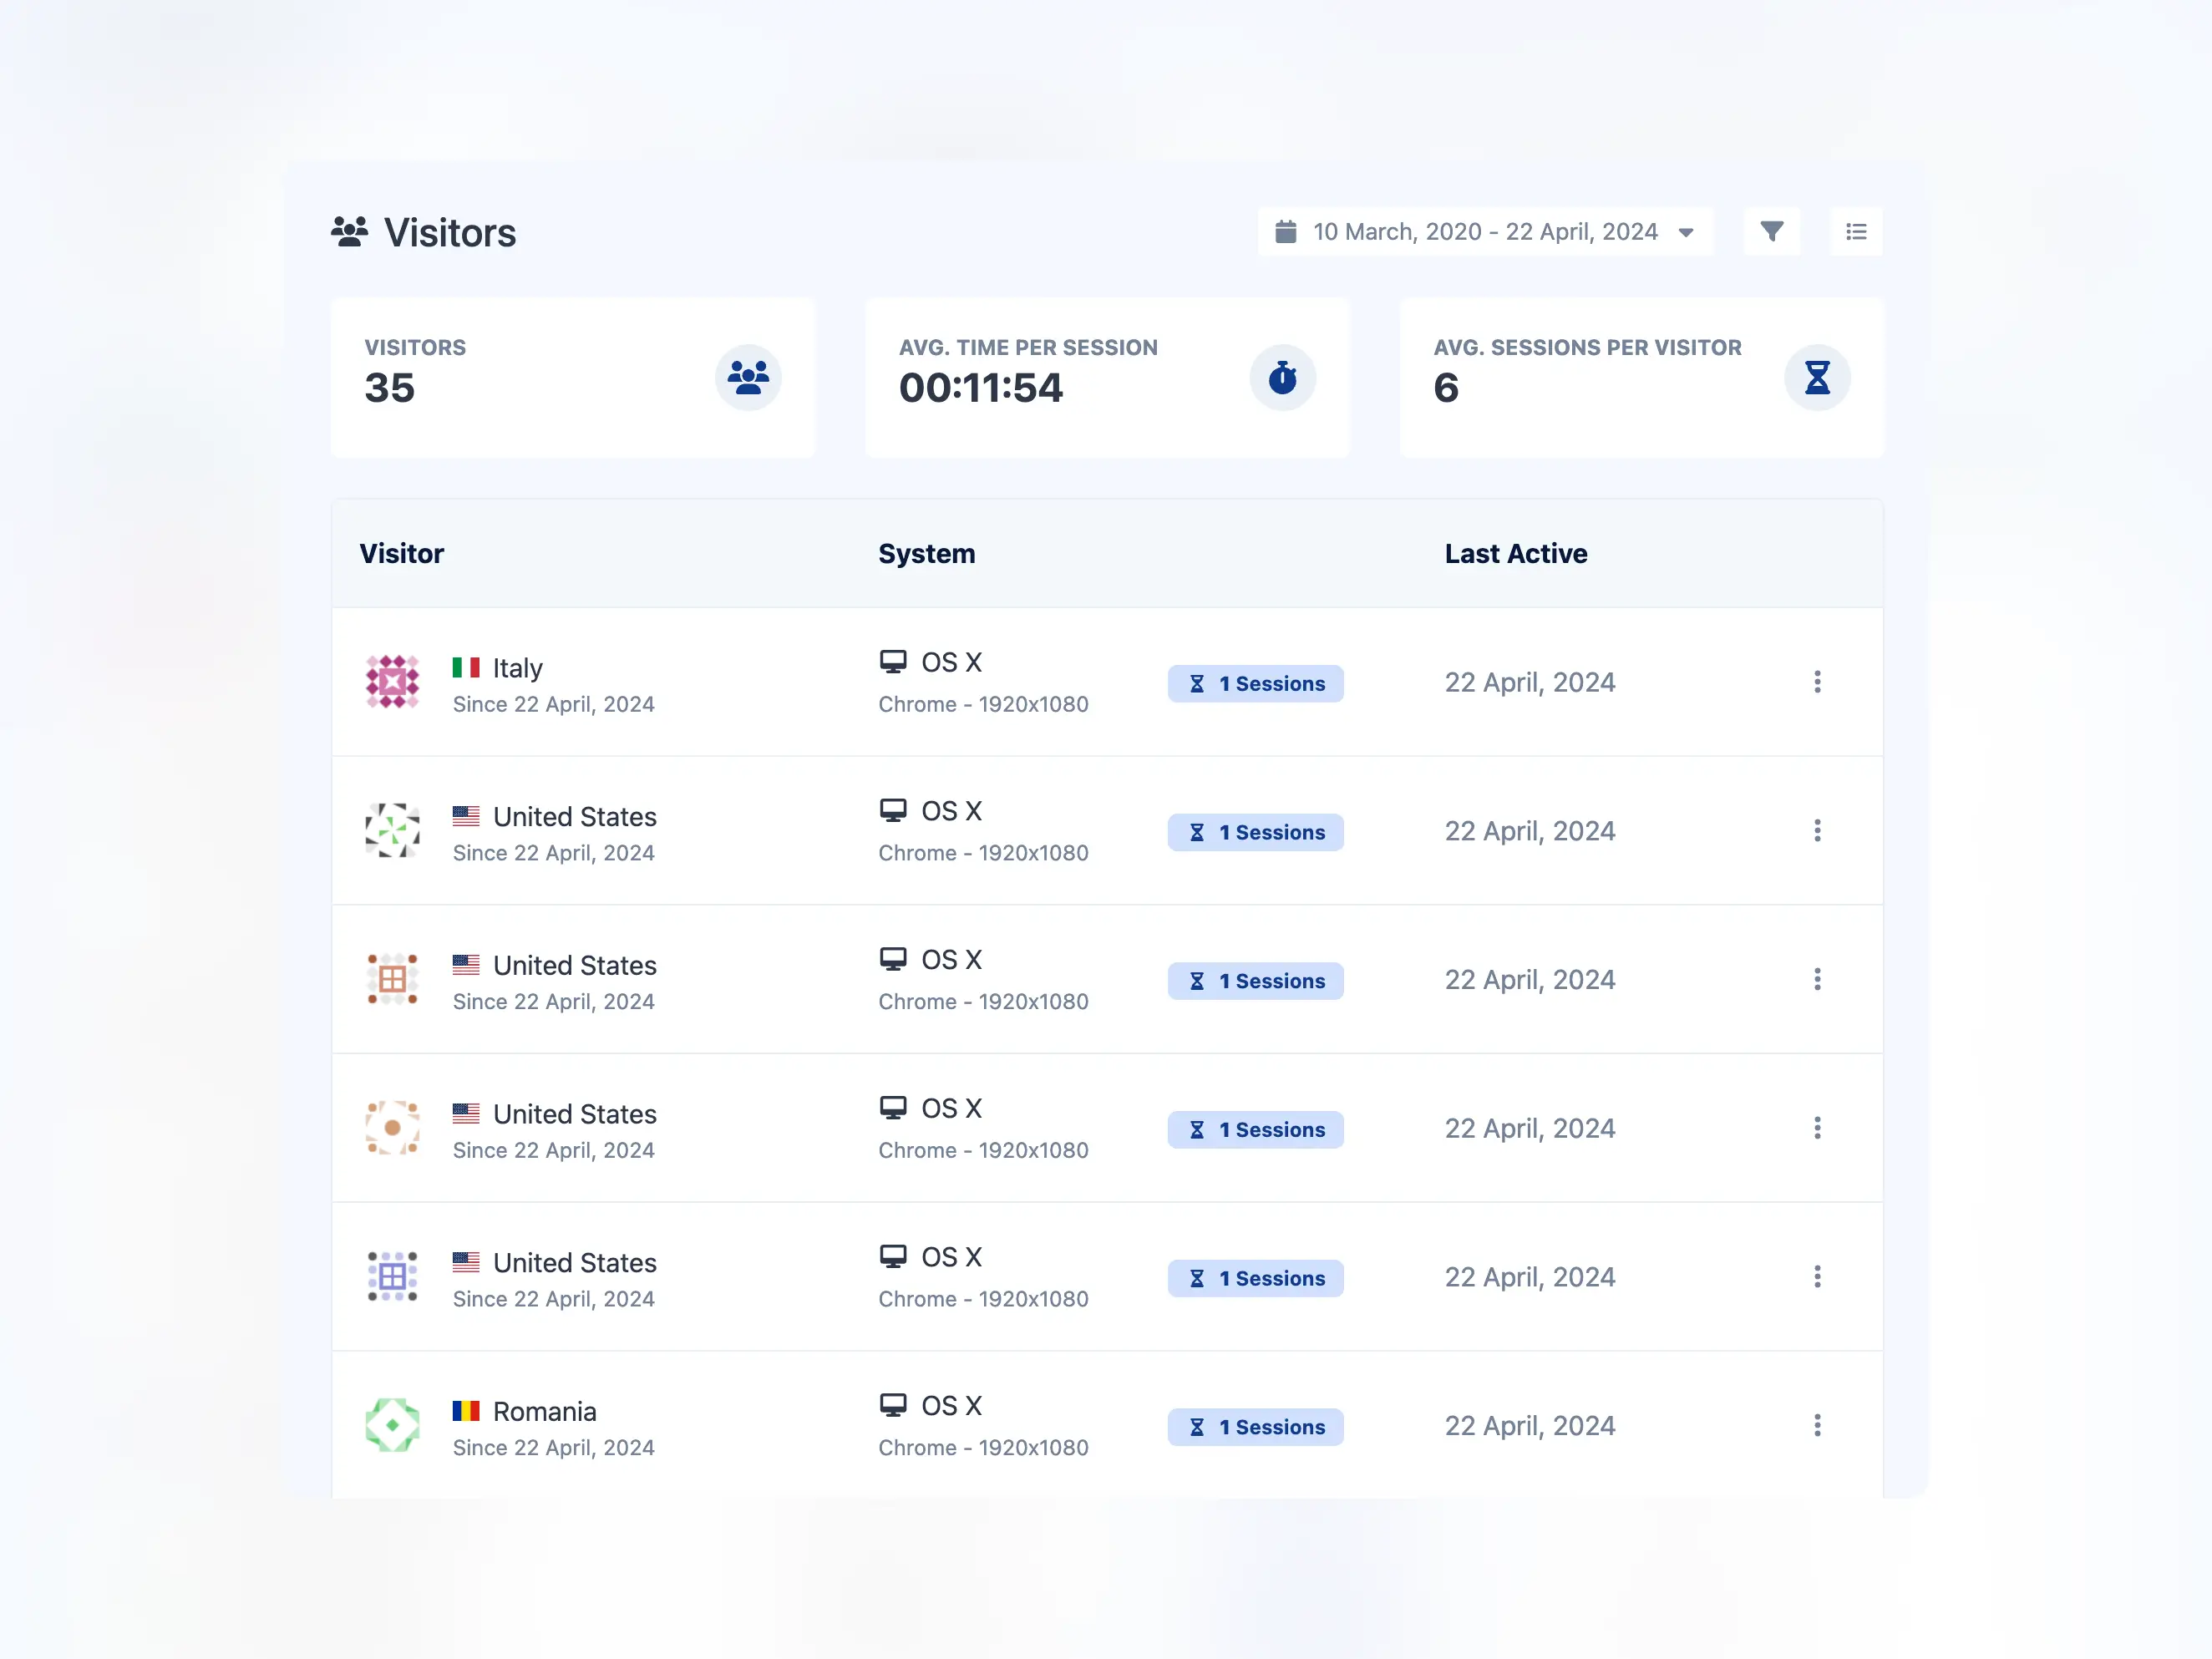
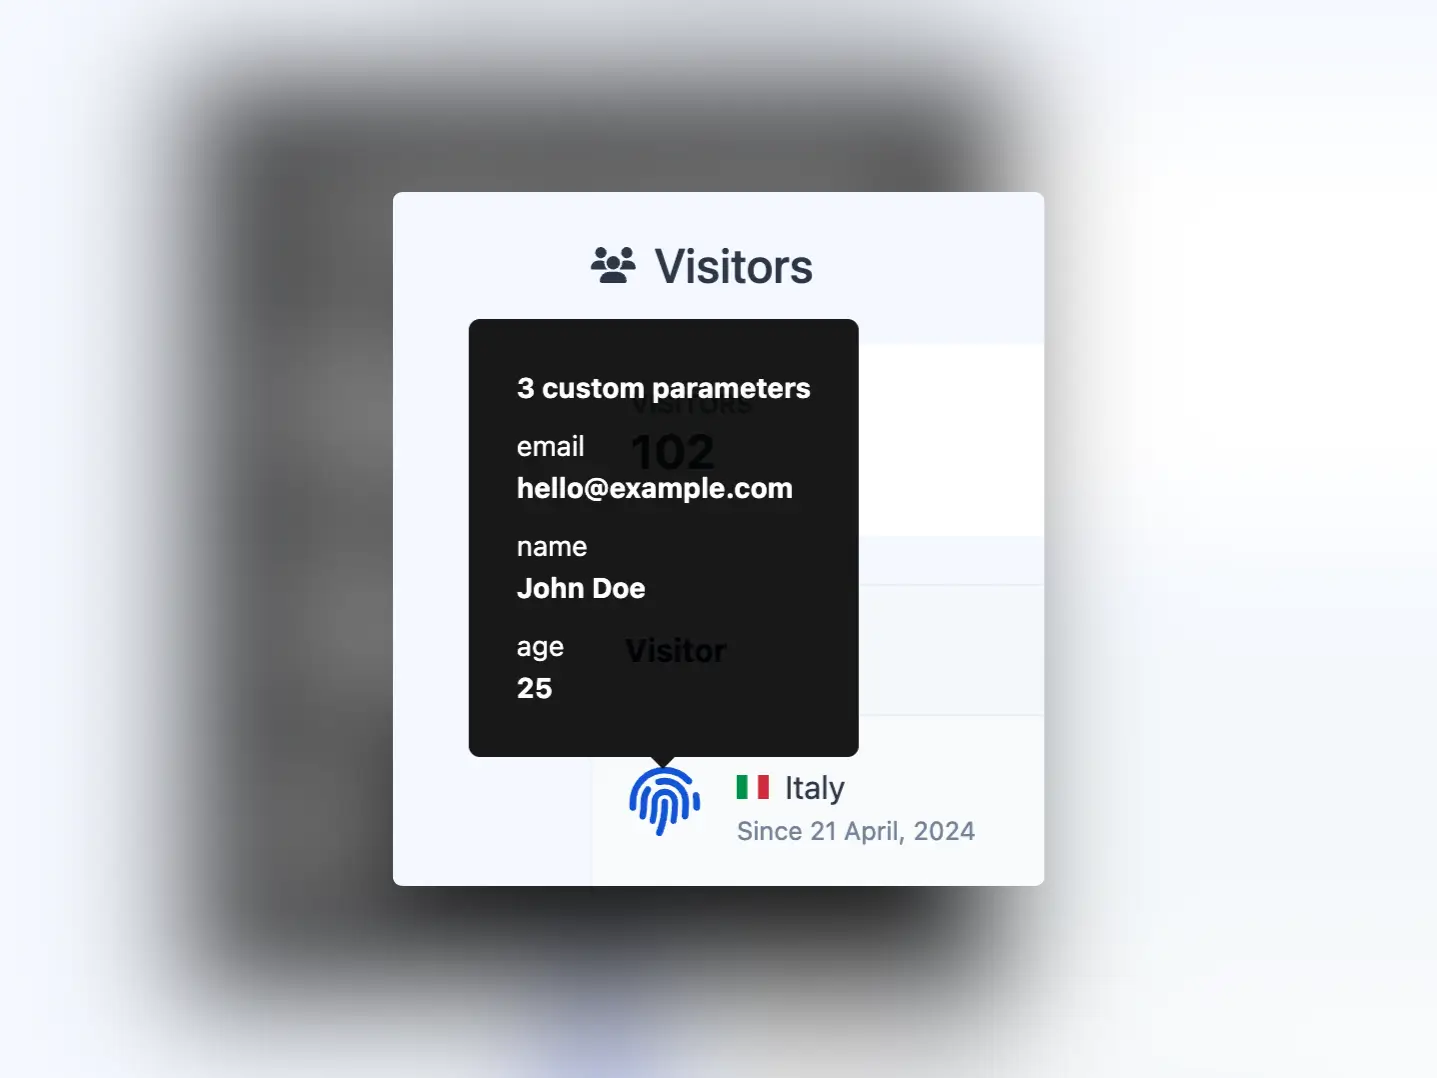
Visitors history
Fully anonymized history of visitors. Get to know when your visitors come back and what they are doing.
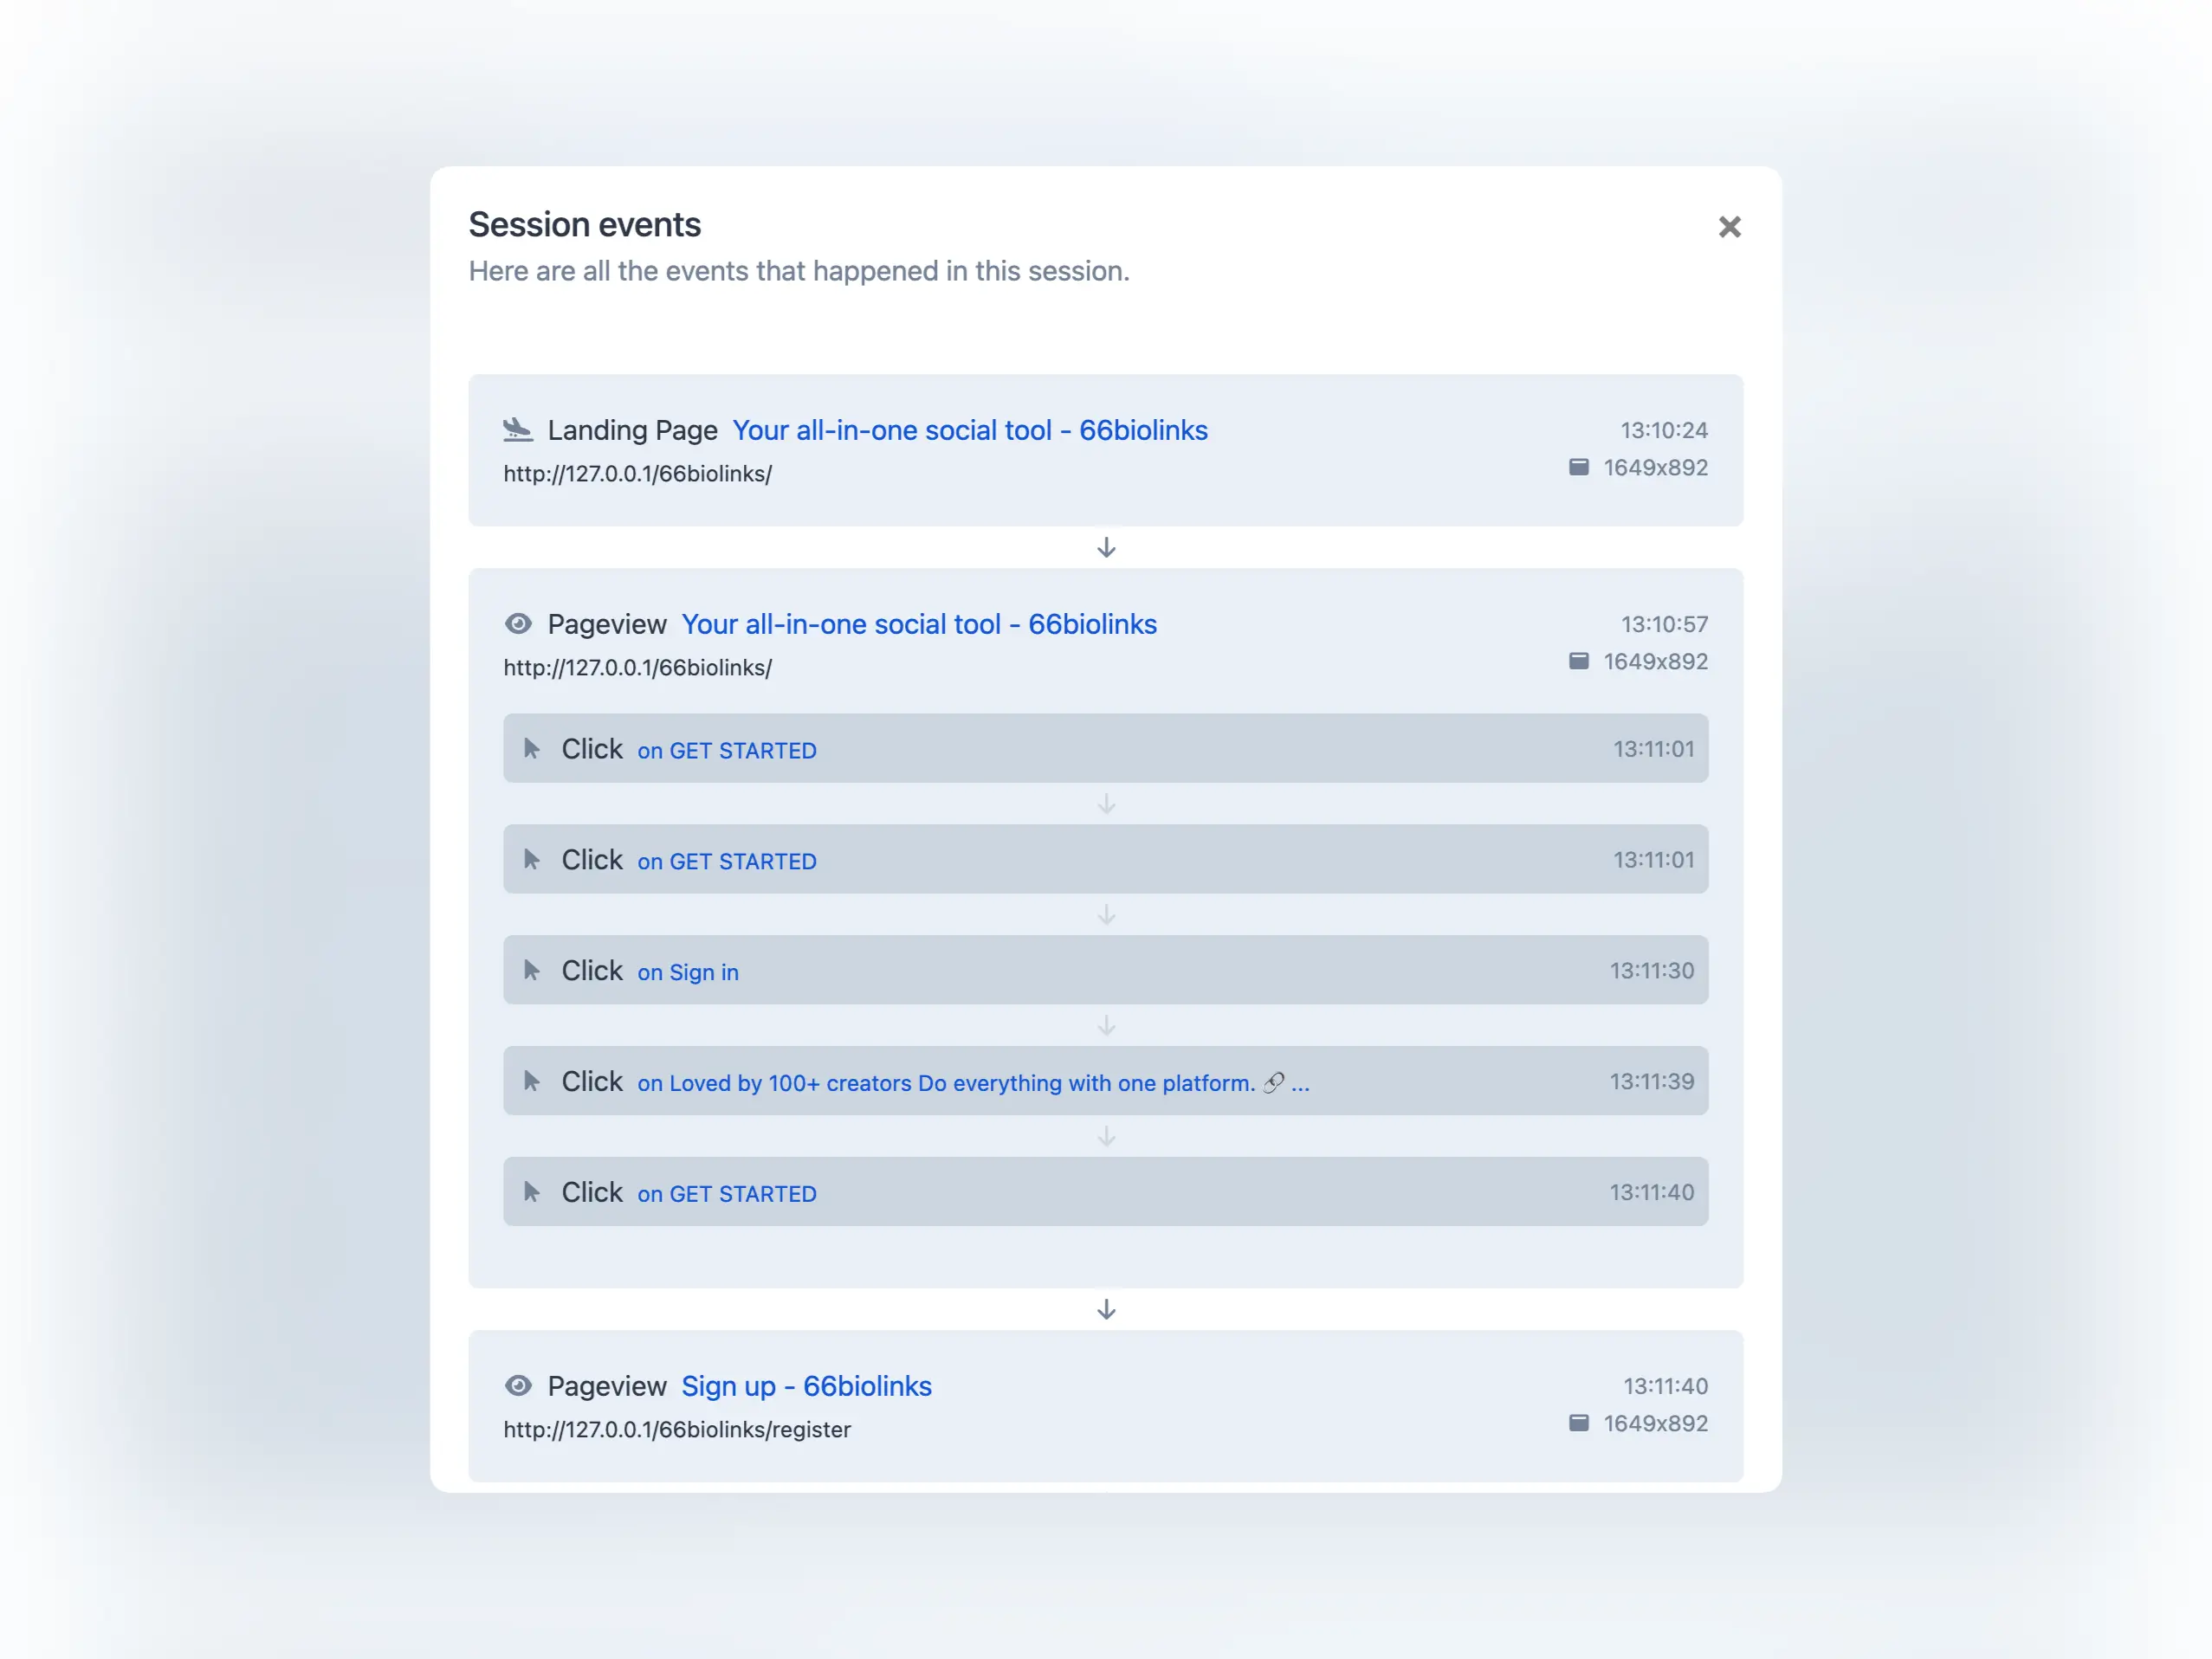
Understand your users
Check each visitors journey on your site without intruding their privacy.
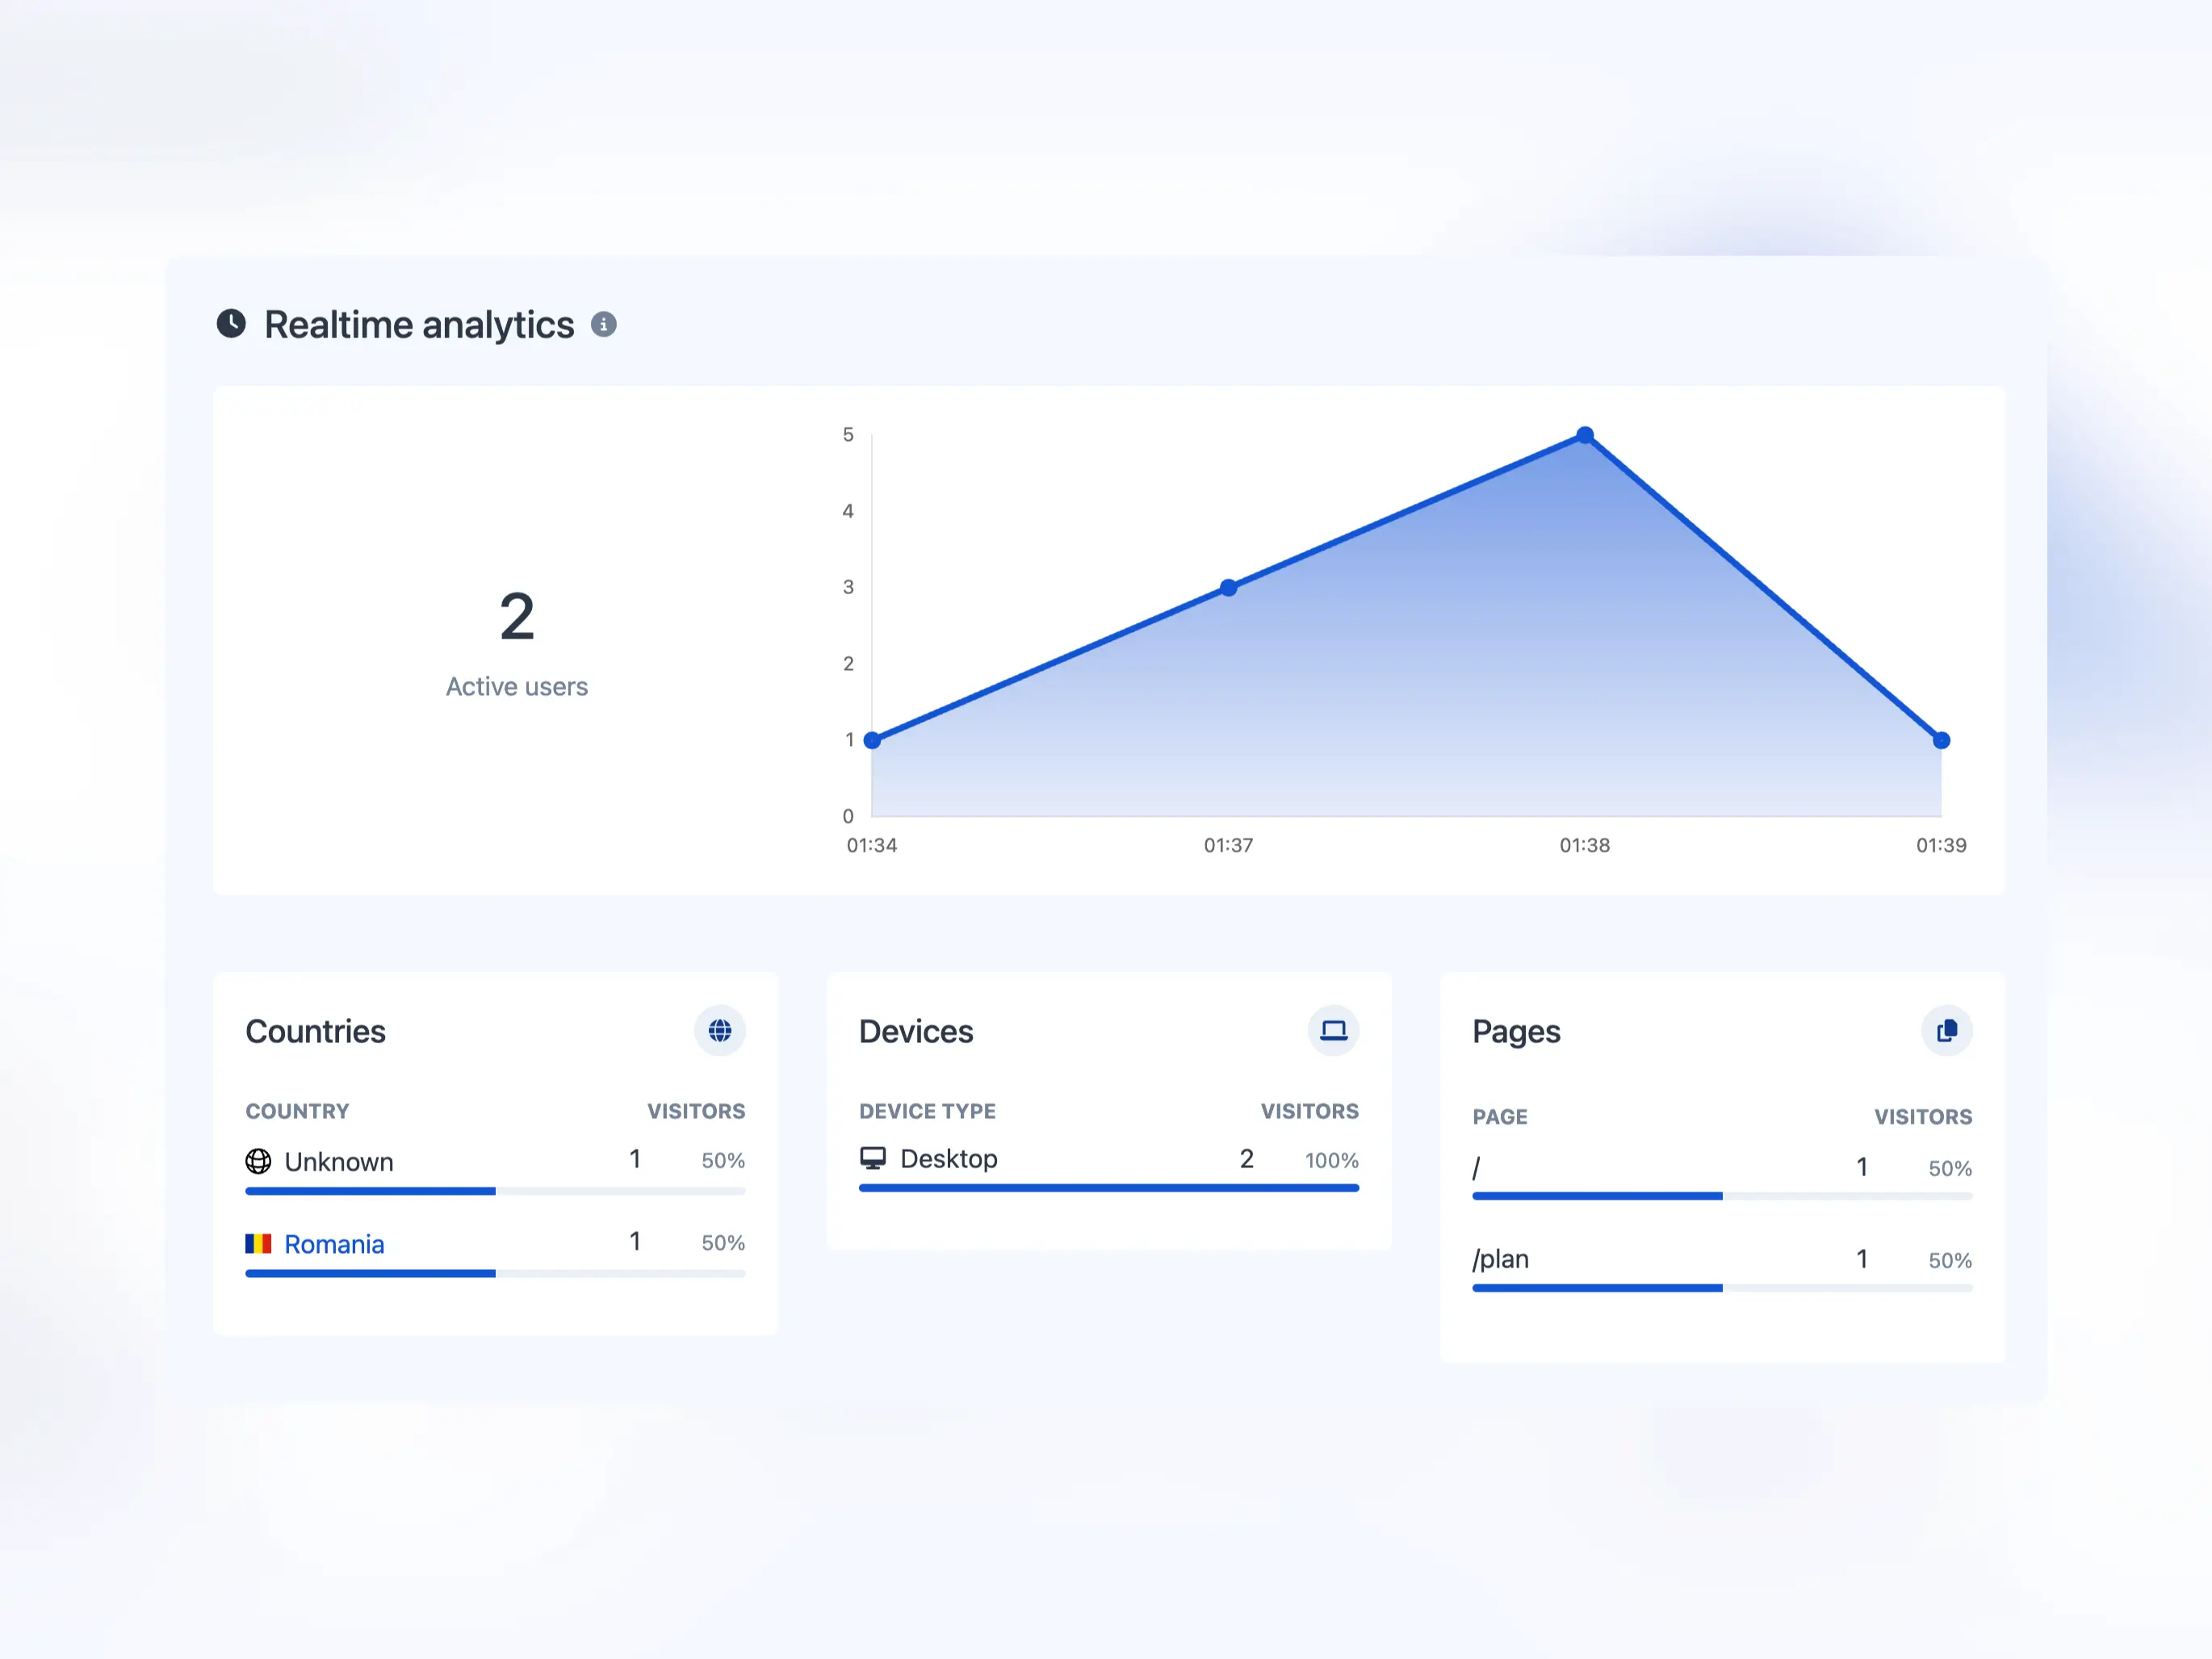
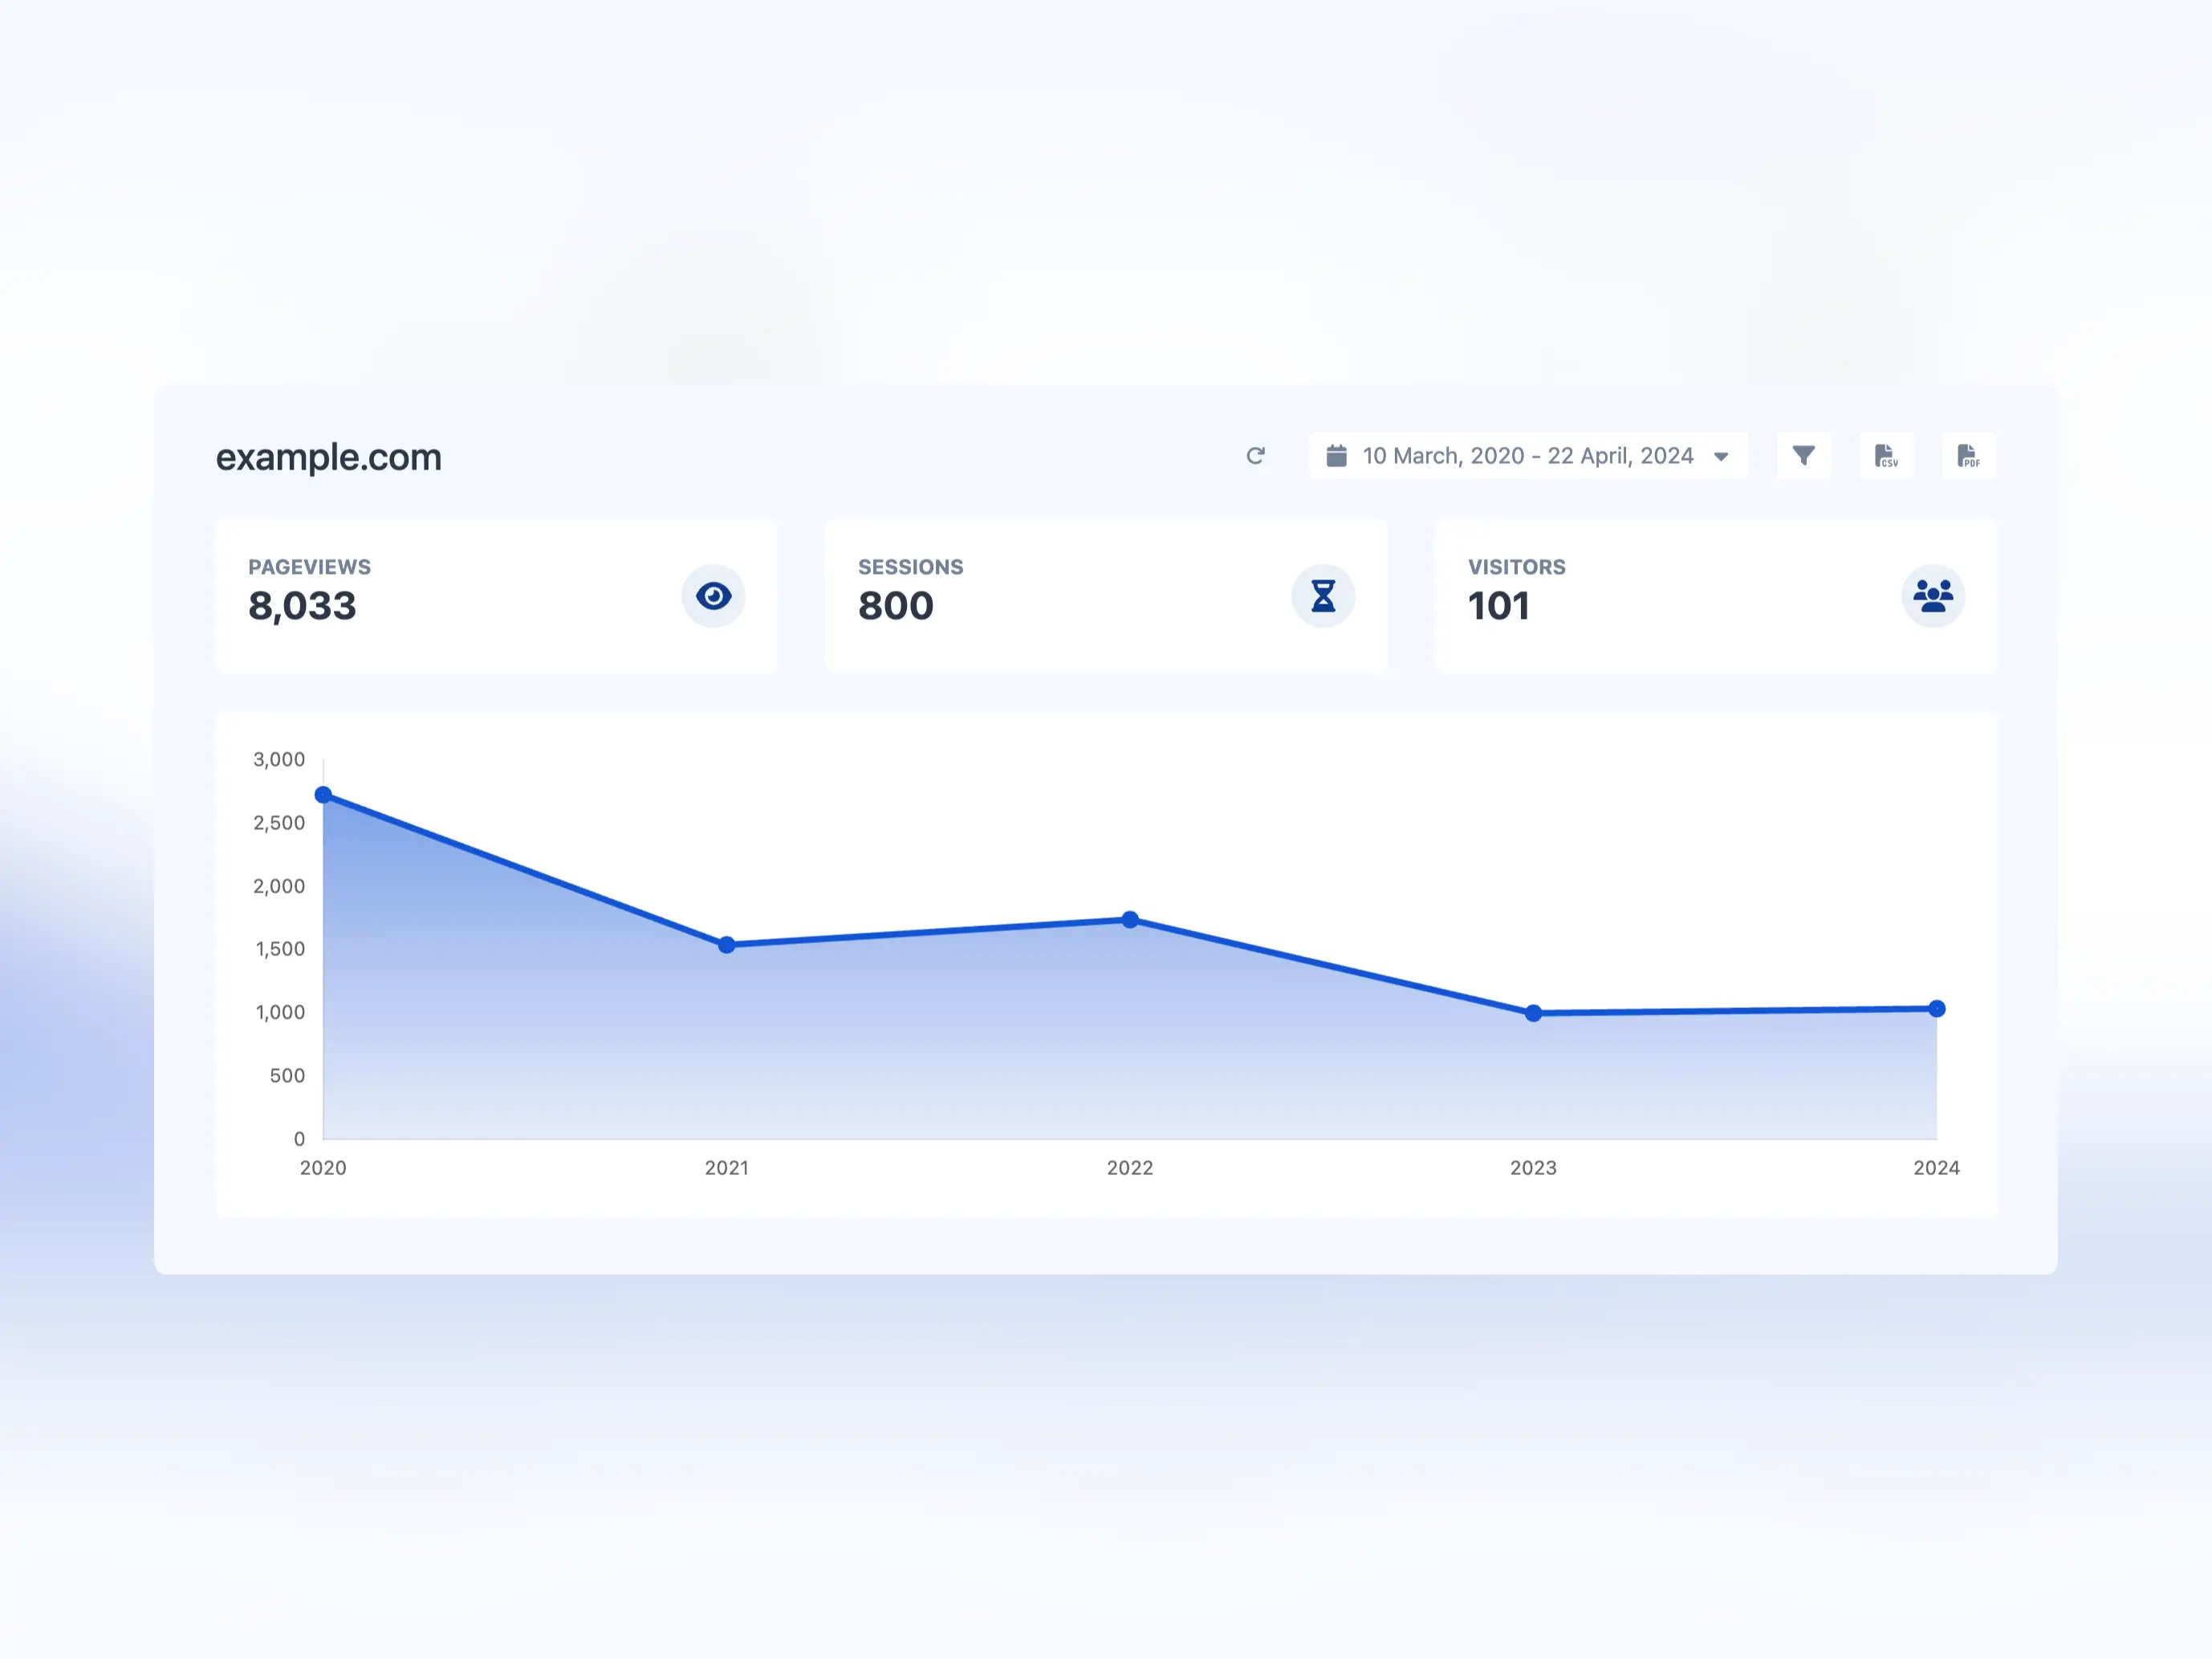
Realtime visitor analytics
Get live data on what your users are doing on your site.
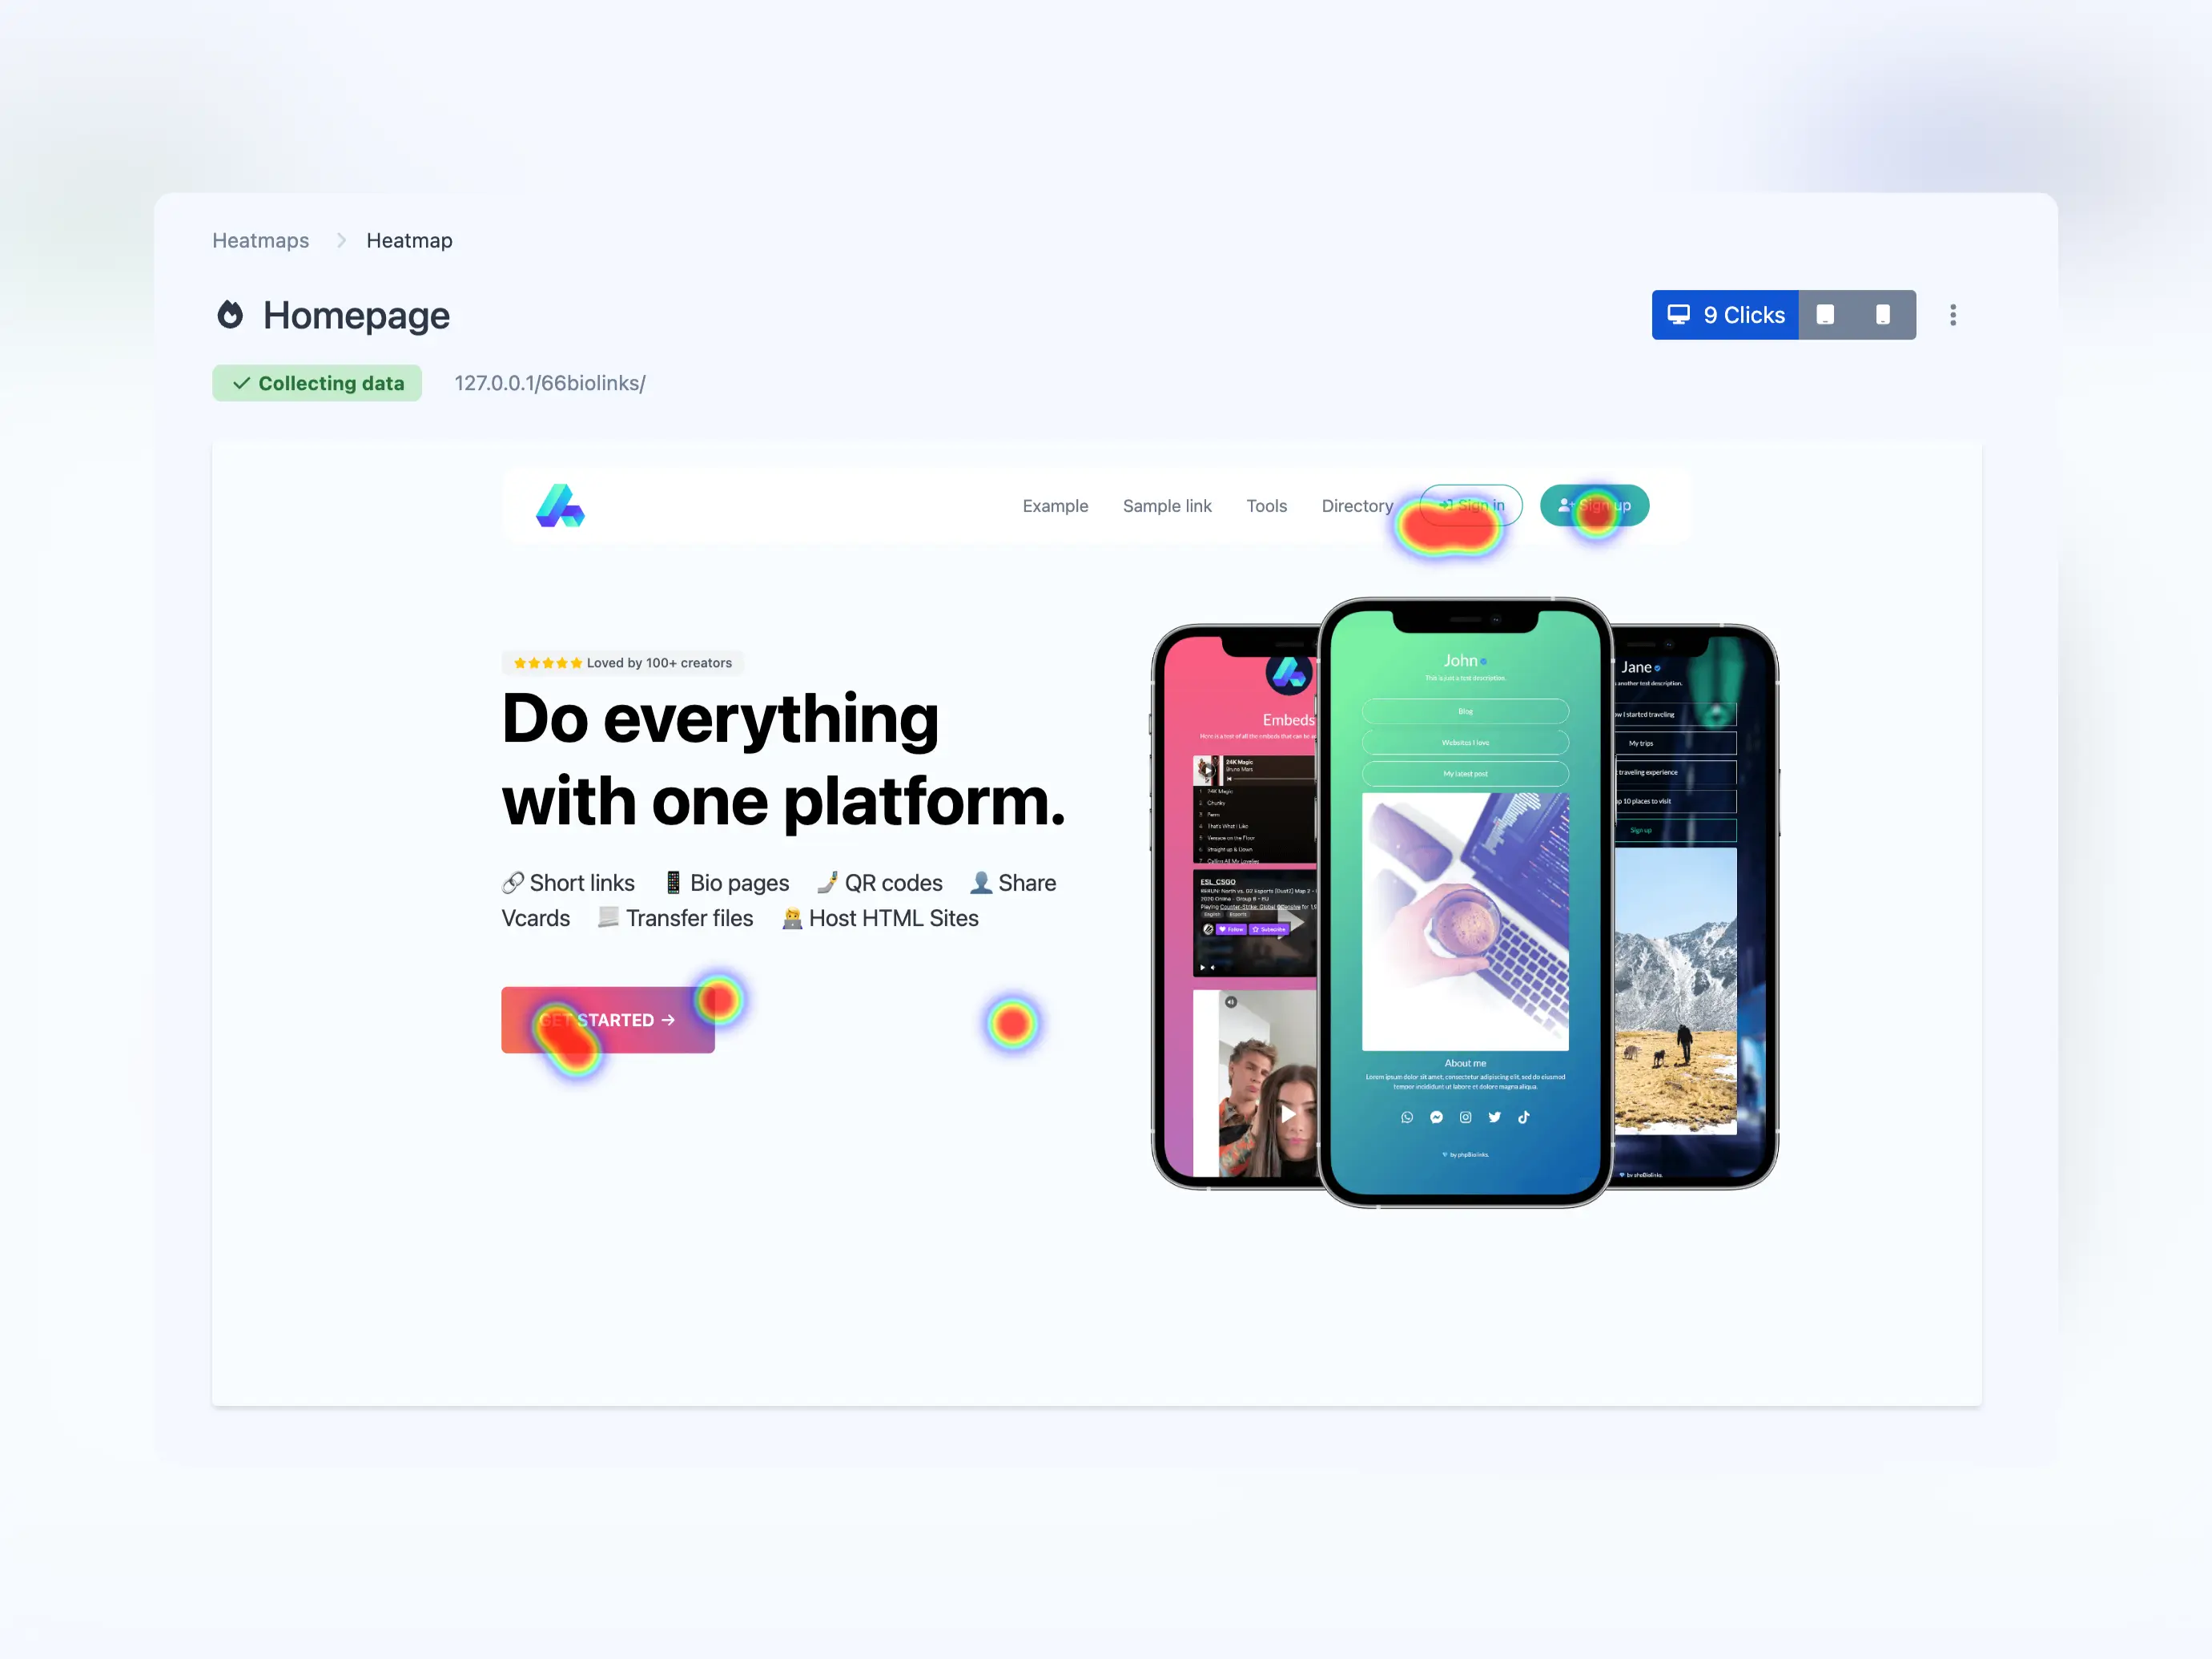
Privacy friendly heatmaps
Collect anonymous click data and generate easy to understand heatmaps.
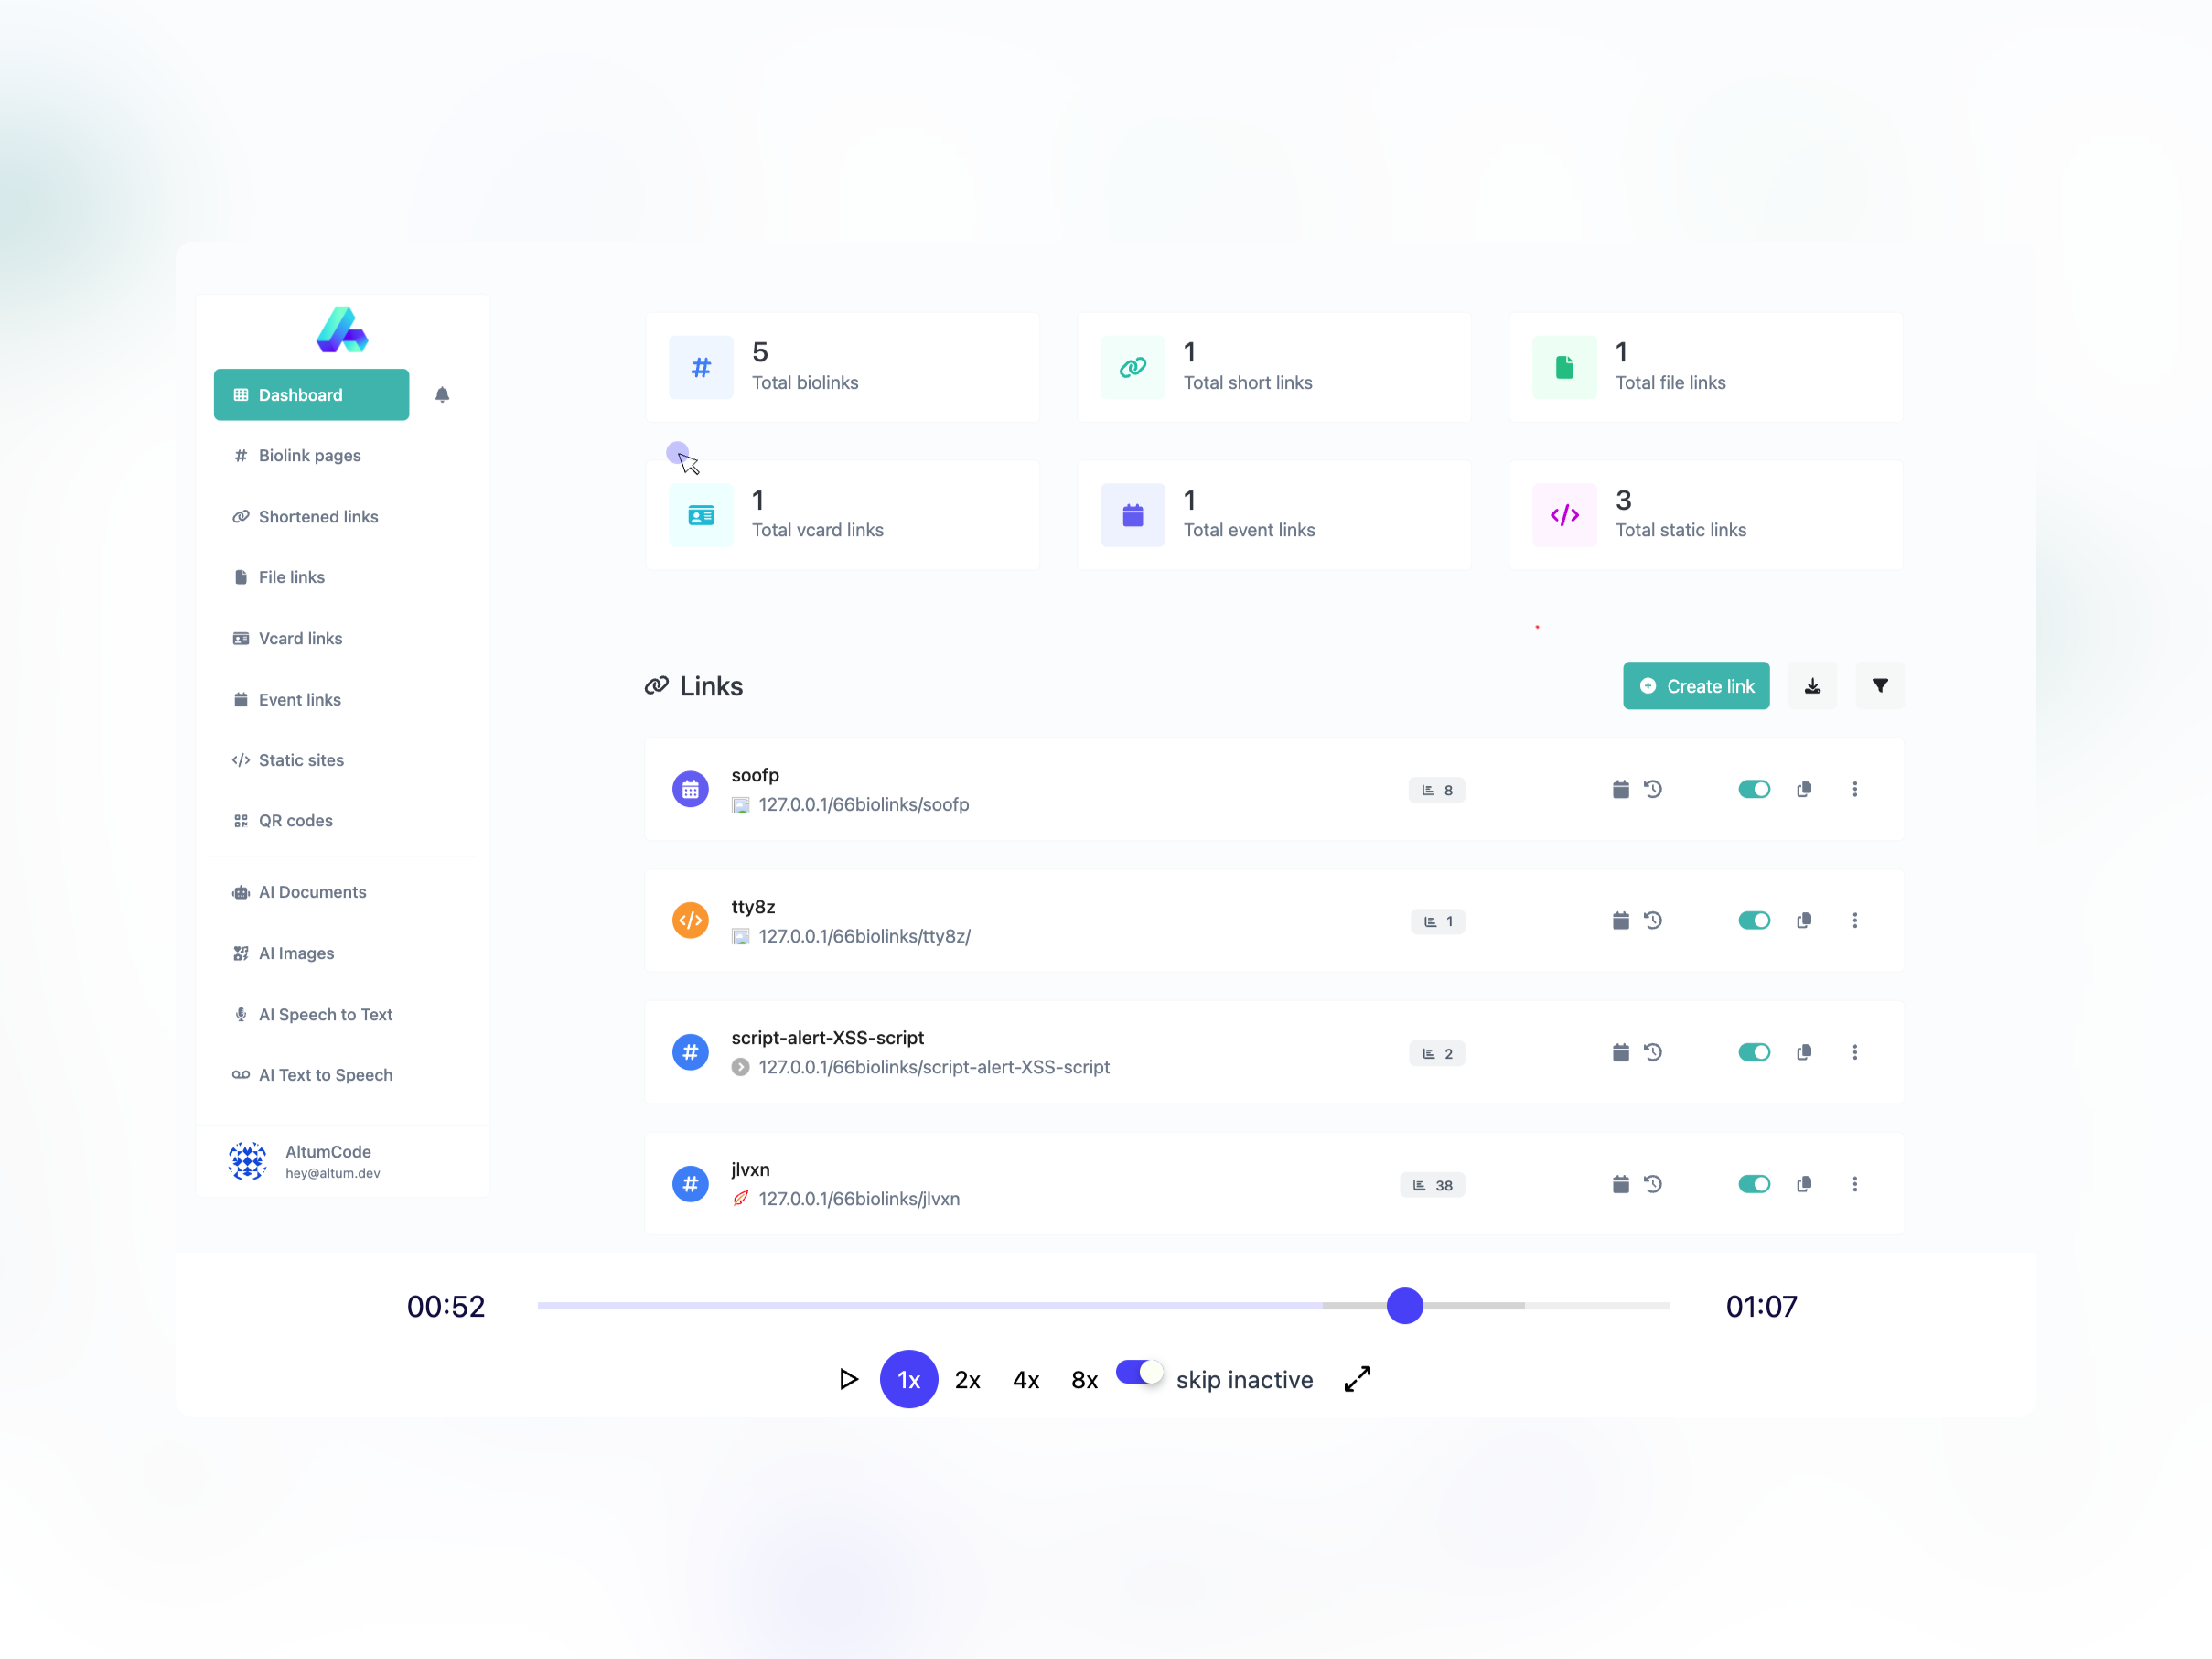
Record & replay visitors sessions
Get to watch a full video representation of what a user did on your website.
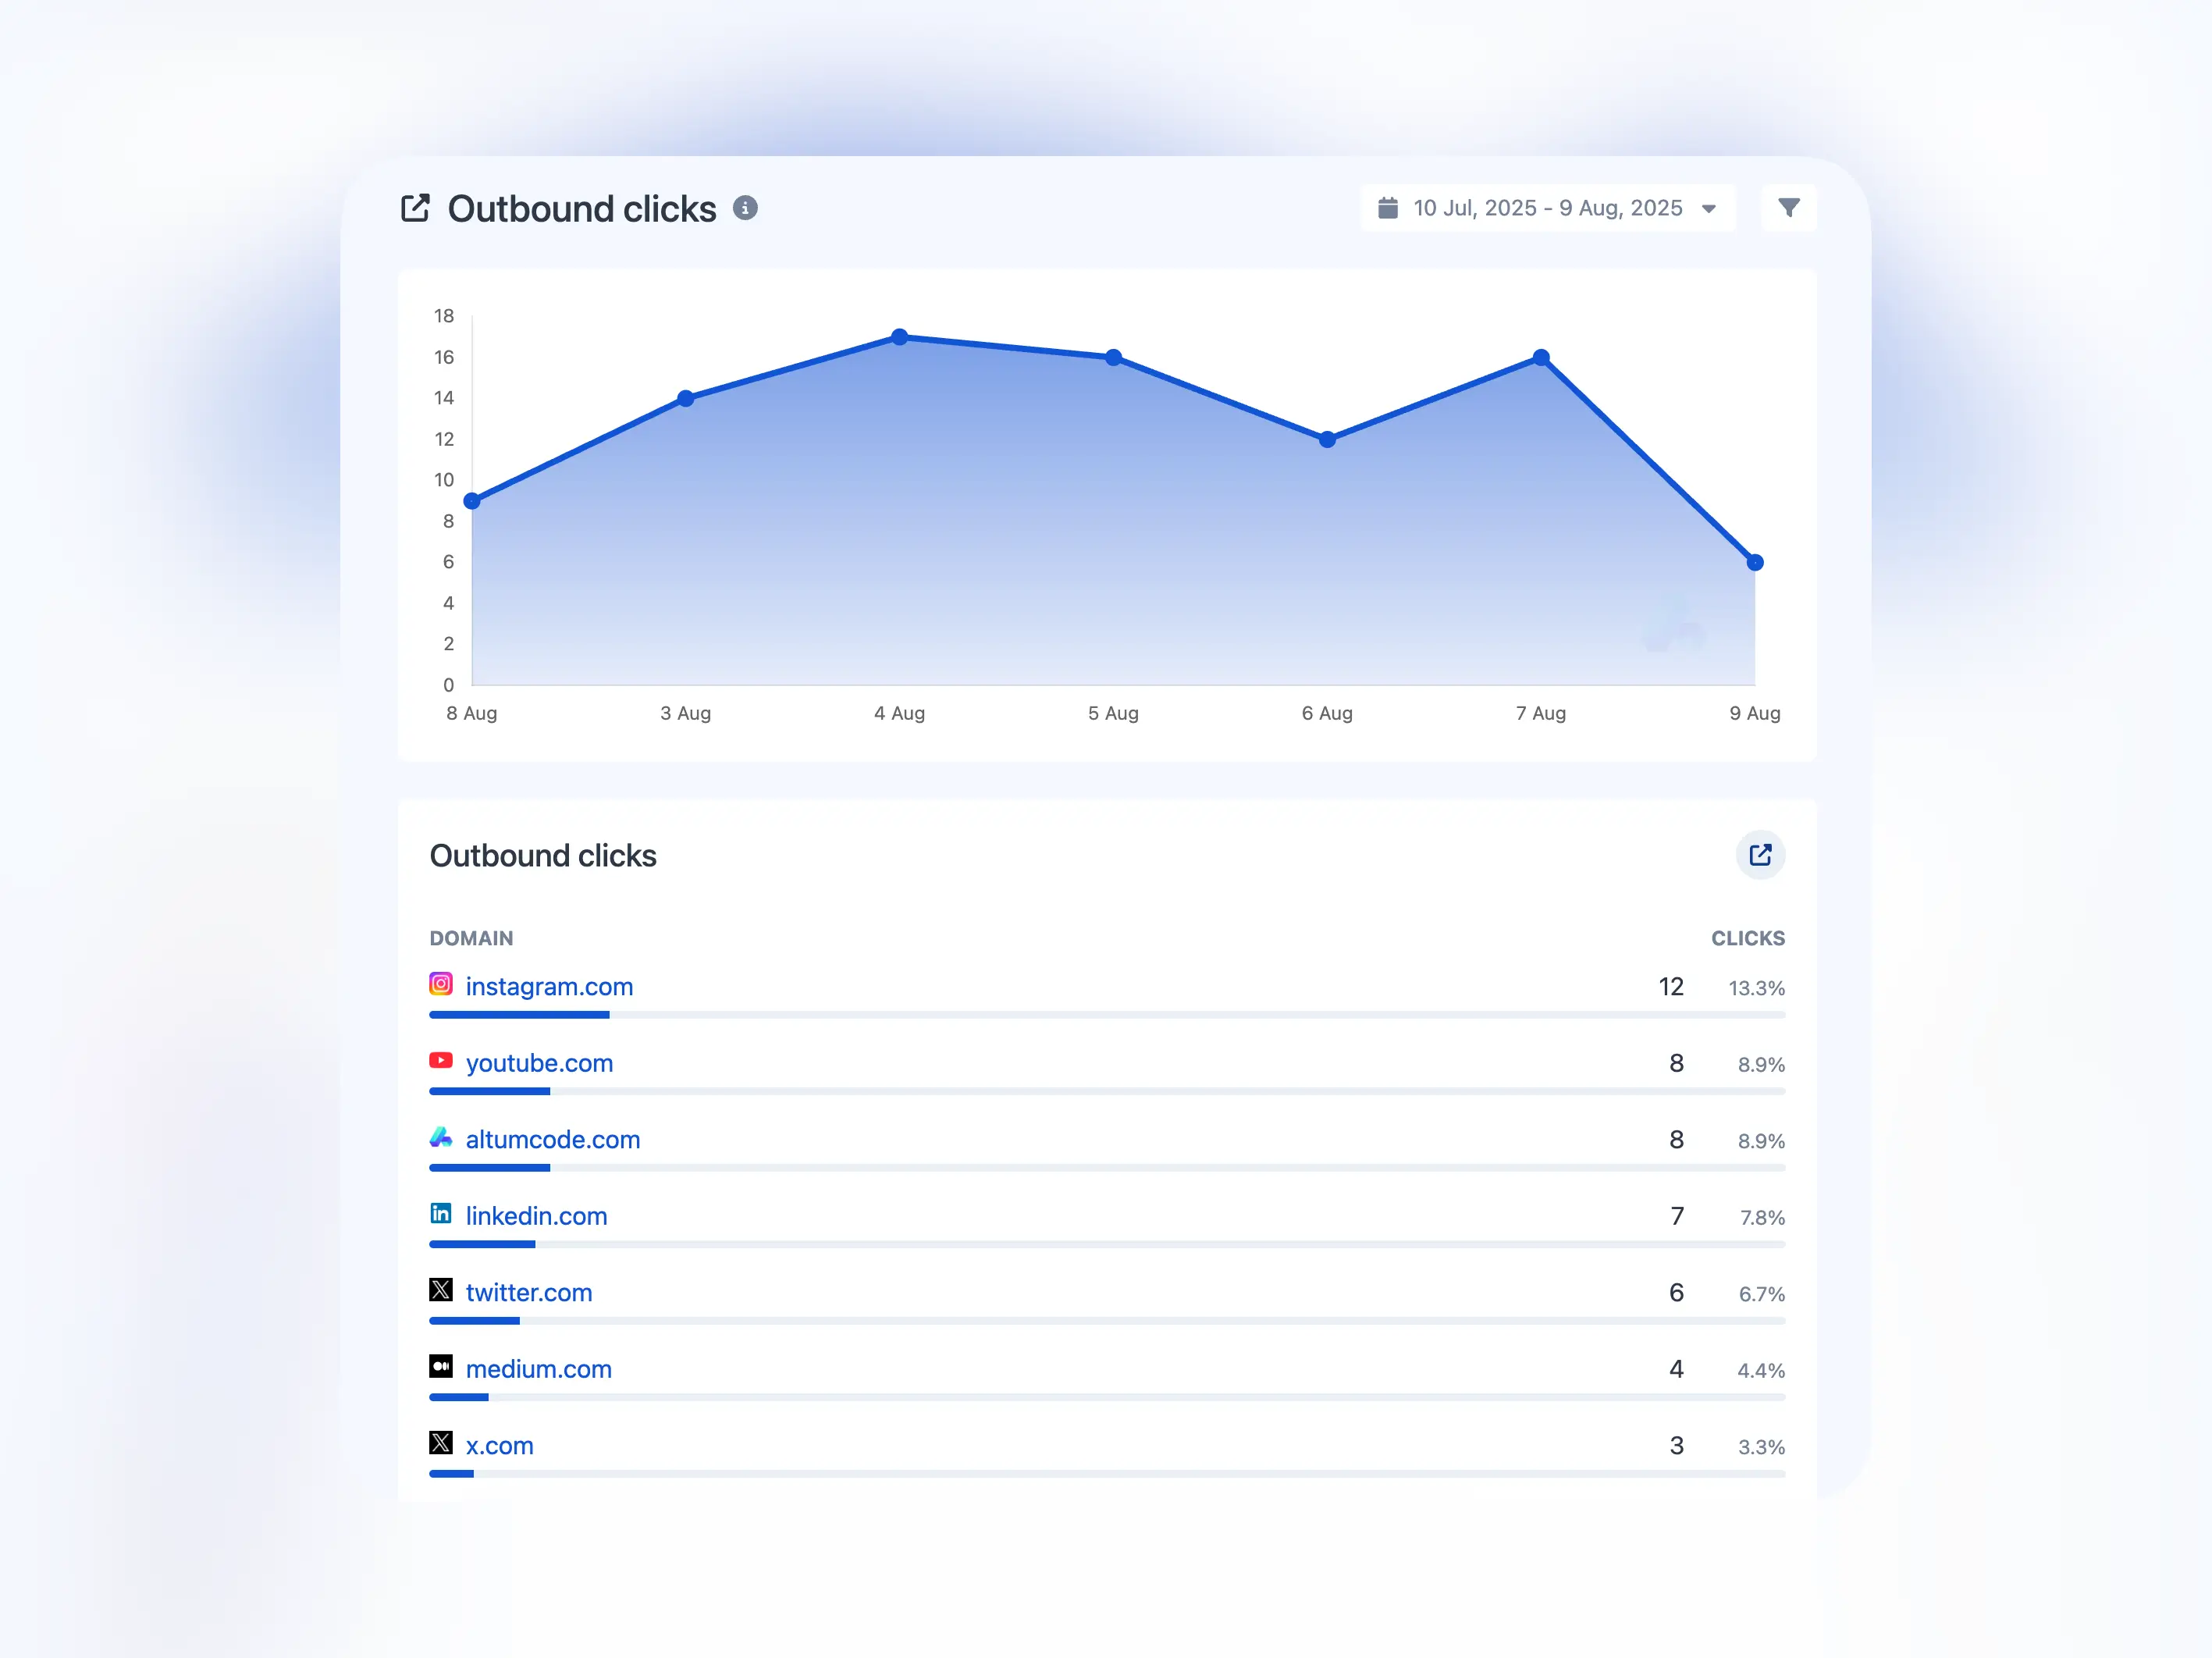
Track outbound link clicks
Monitor when and where your visitors click links that lead away from your site.
Easy setup & integration on any website.
Copy and paste one line of code into your website.
Developer ready
Fully featured & easy to use API system for developers.
--url 'https://analytics.innovhub.online/api/statistics/1' \
--header 'Authorization: Bearer {api_key}' \
--header 'Content-Type: multipart/form-data' \
--form 'start_date=2026-05-03' \
--form 'end_date=2026-06-03' \
--form 'type=overview' \
Why people love us

“ Analytics InnovHub transformed how we understand our store’s performance. Before, we were guessing at trends now we have real data driving decisions. Our conversion rate improved 42% in 90 days thanks to insights we never had before! ”

“ Finally, an analytics tool that’s powerful and easy to use. The dashboards are intuitive, the reports are clear, and I can share performance metrics with clients in seconds. It’s become an essential part of how I run campaigns. ”

“ Switching to Analytics InnovHub was one of the best strategic decisions we made this year. We uncovered hidden user behavior trends that helped us refine our funnel and reduce churn. Support is responsive and always ready to help highly recommend! ”
Simple, transparent pricing.
Choose the plan that is right for you and your budget.
Free Plan
-
1 tracked websites
-
500 pageviews
per month, per website -
7 days data retention for pageviews
-
500 visitors events
per month, per website -
7 days data retention for visitors events
-
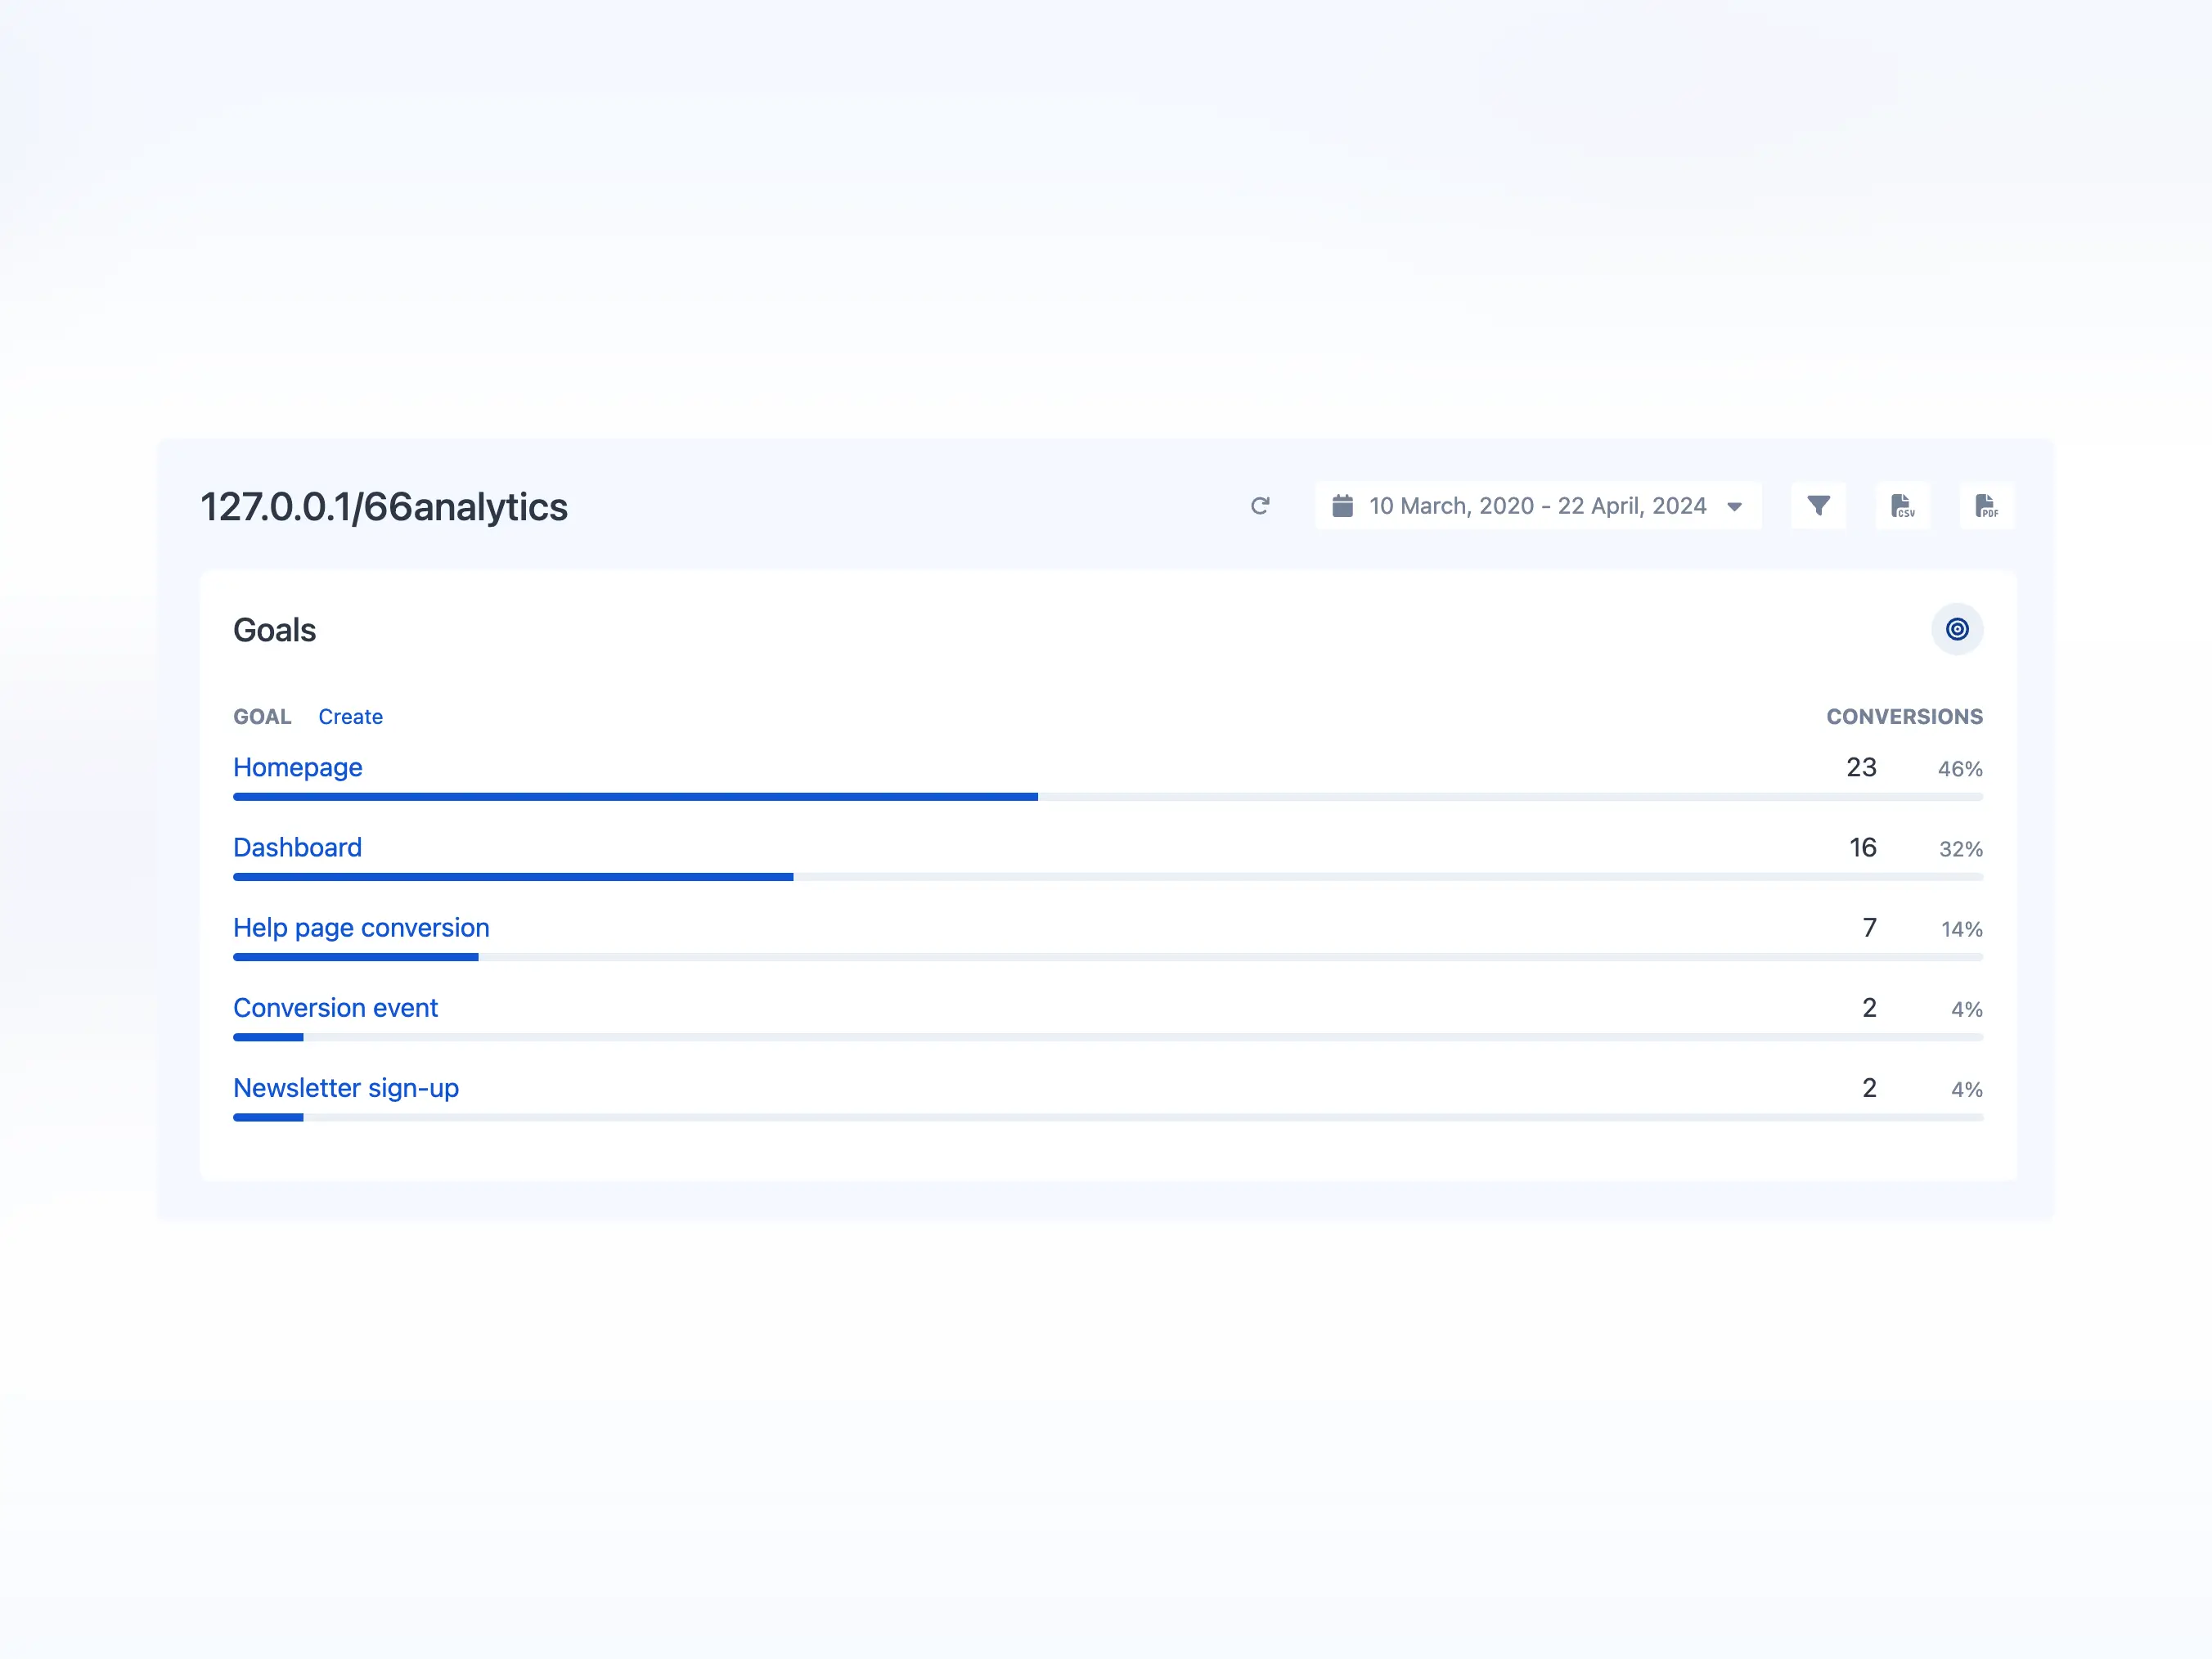
1 goals/events
-
0 chart annotations
-
1 video replays
per month, per website -
7 days data retention for video replays
-
1 heatmaps
-
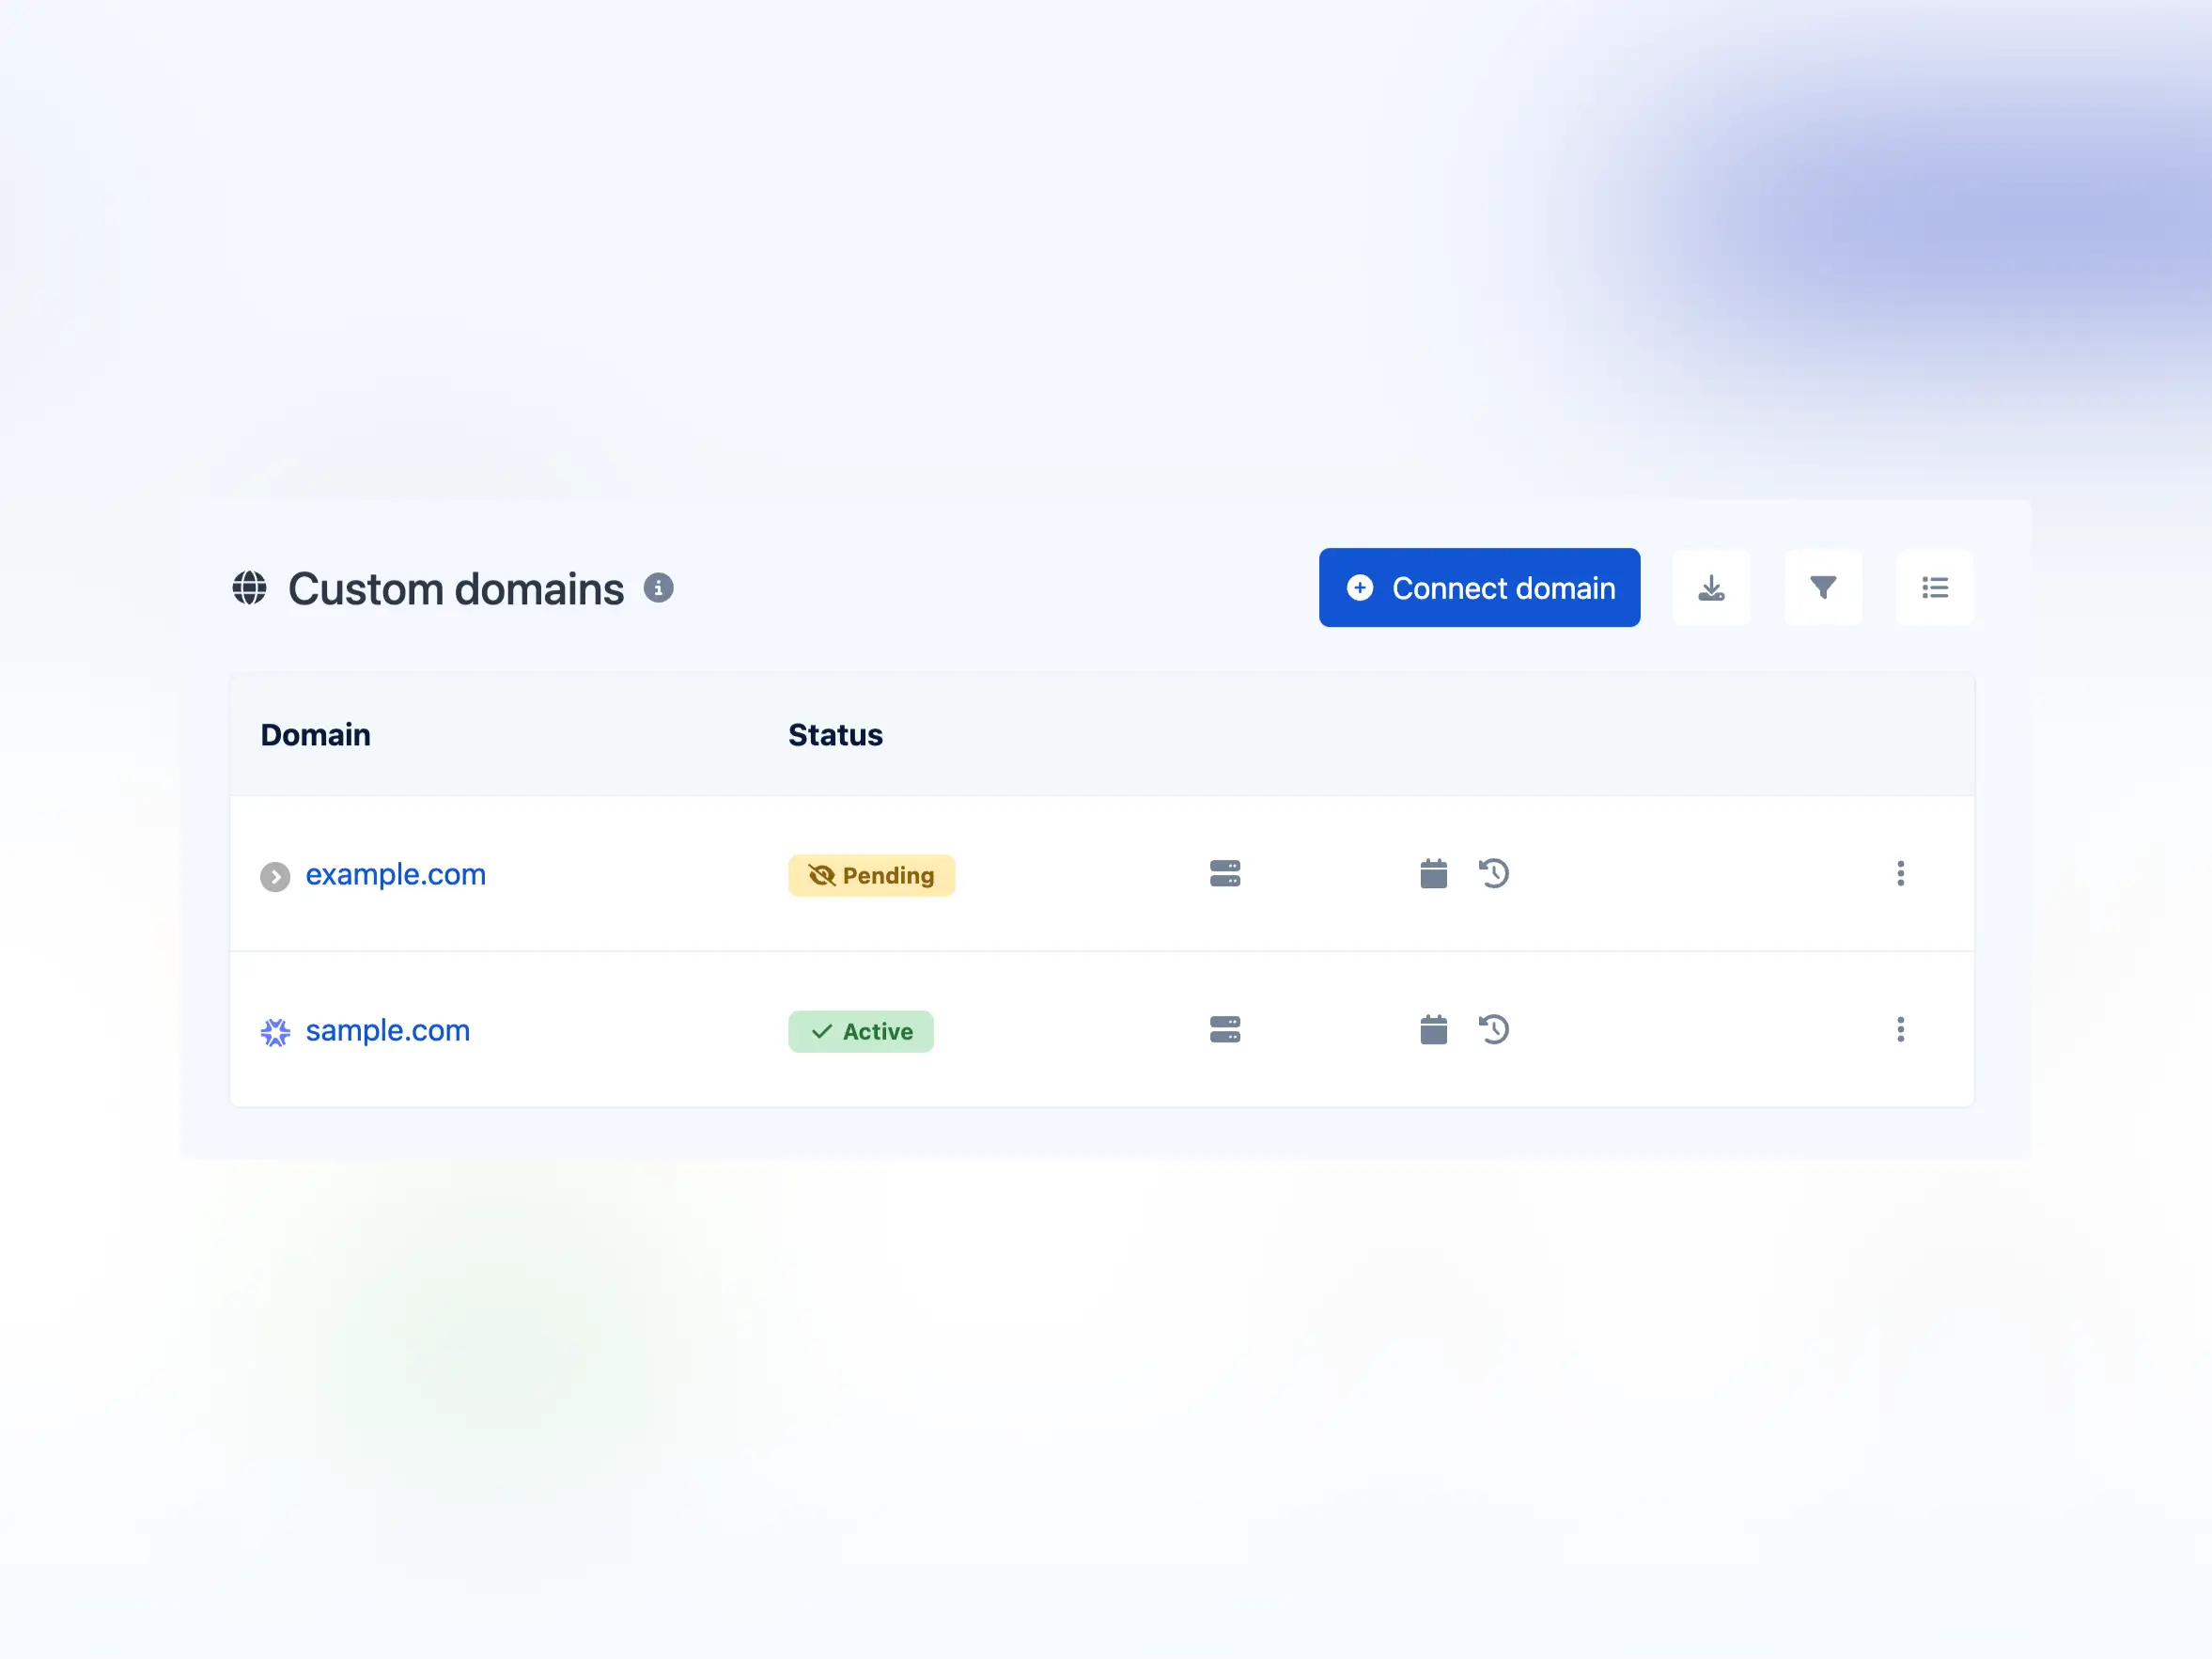
0 custom domains
-
0 additional domains
-
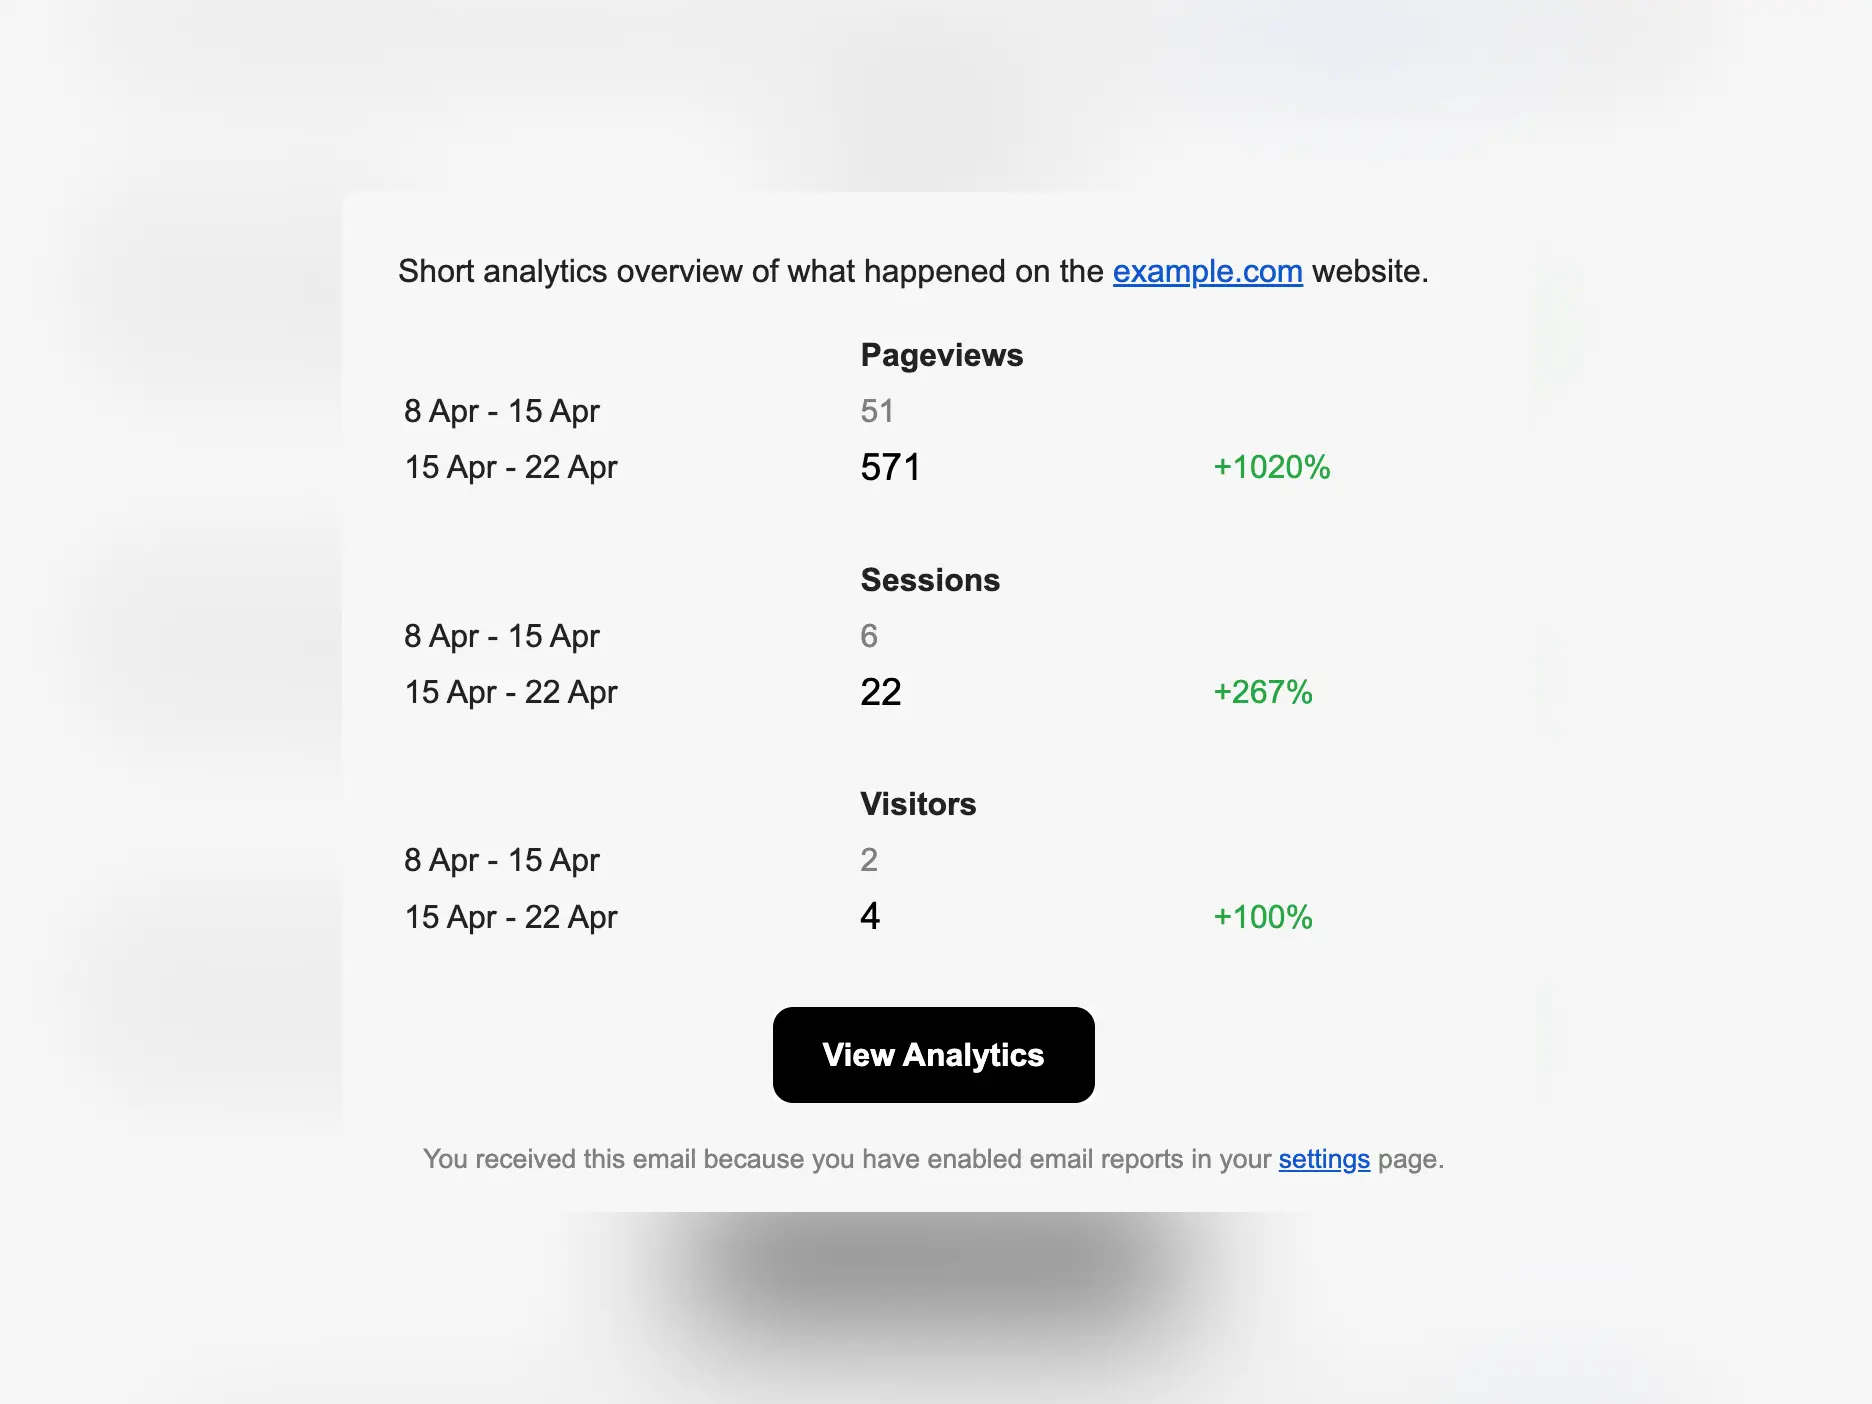
Weekly email reports
-
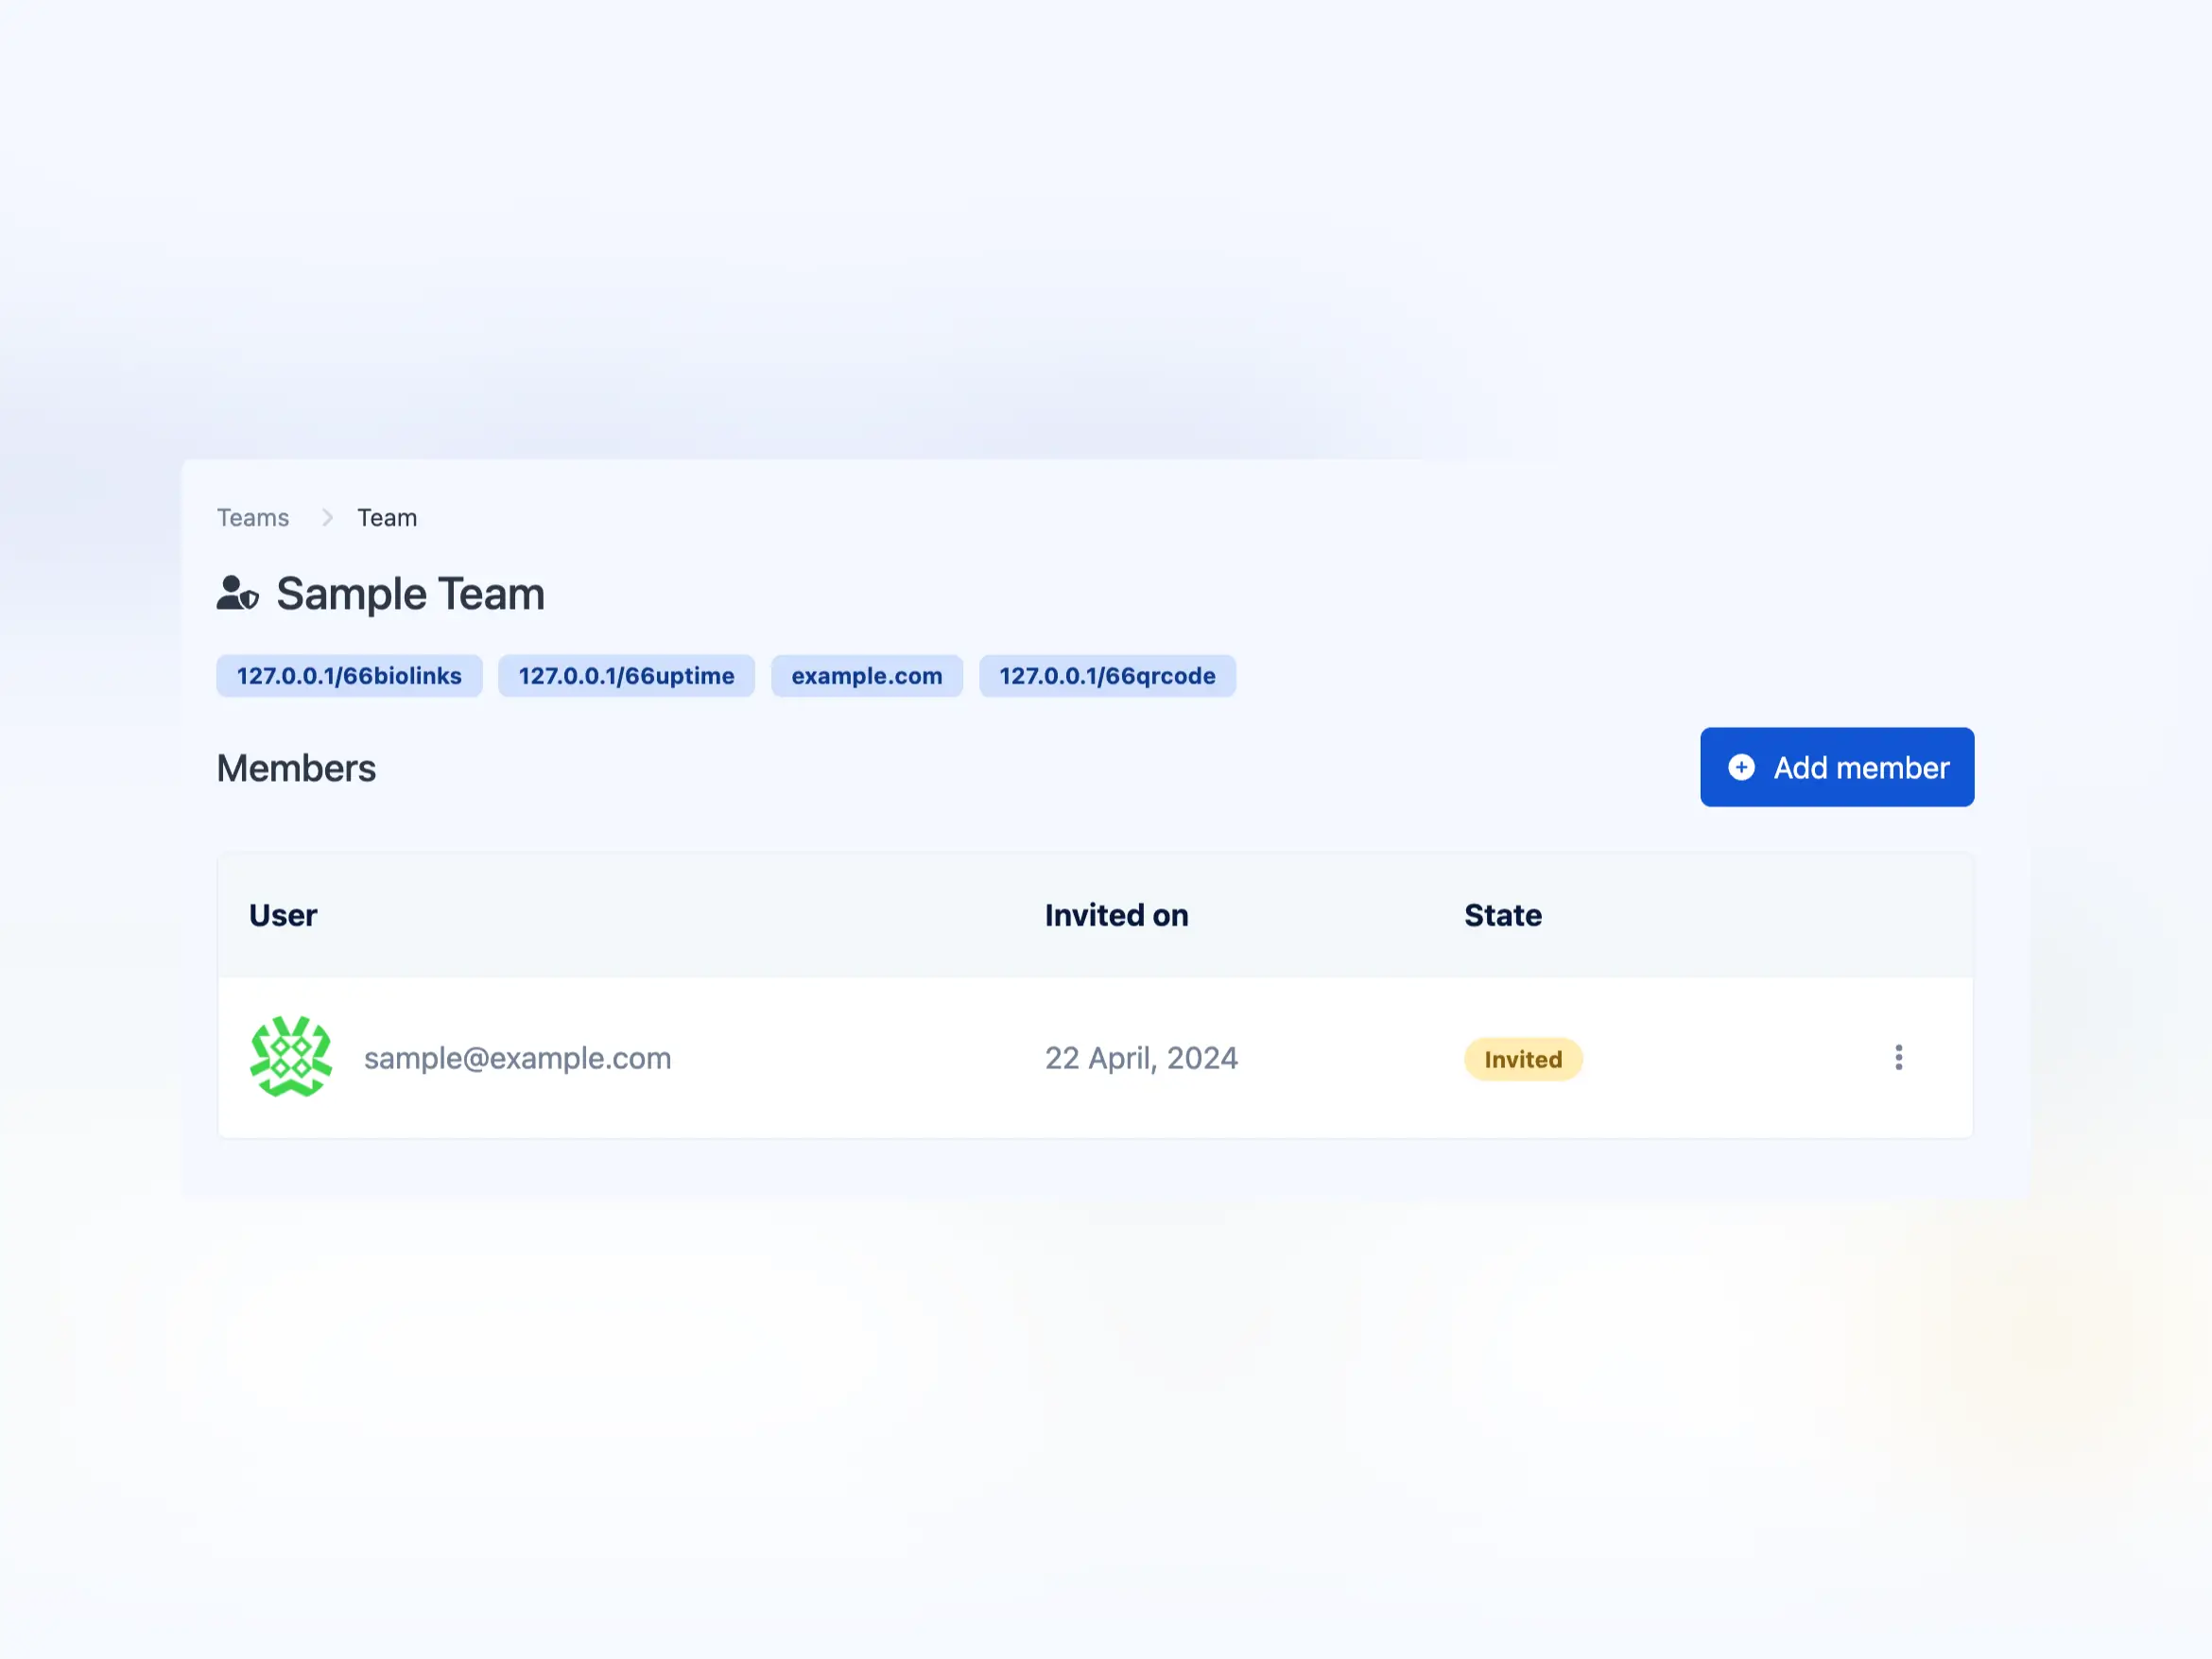
Teams
-
No ads
-
API access
-
0 export features
Answer for your common question
Own your analytics.
Simple to understand analytics, yet highly powerful.
Latest blog posts
The Role of Real-Time Analytics in Decision Making
In an era where timely information can make or break a business, real-time analytics plays a crucial role in empowering companies to make quick, informed decisions.

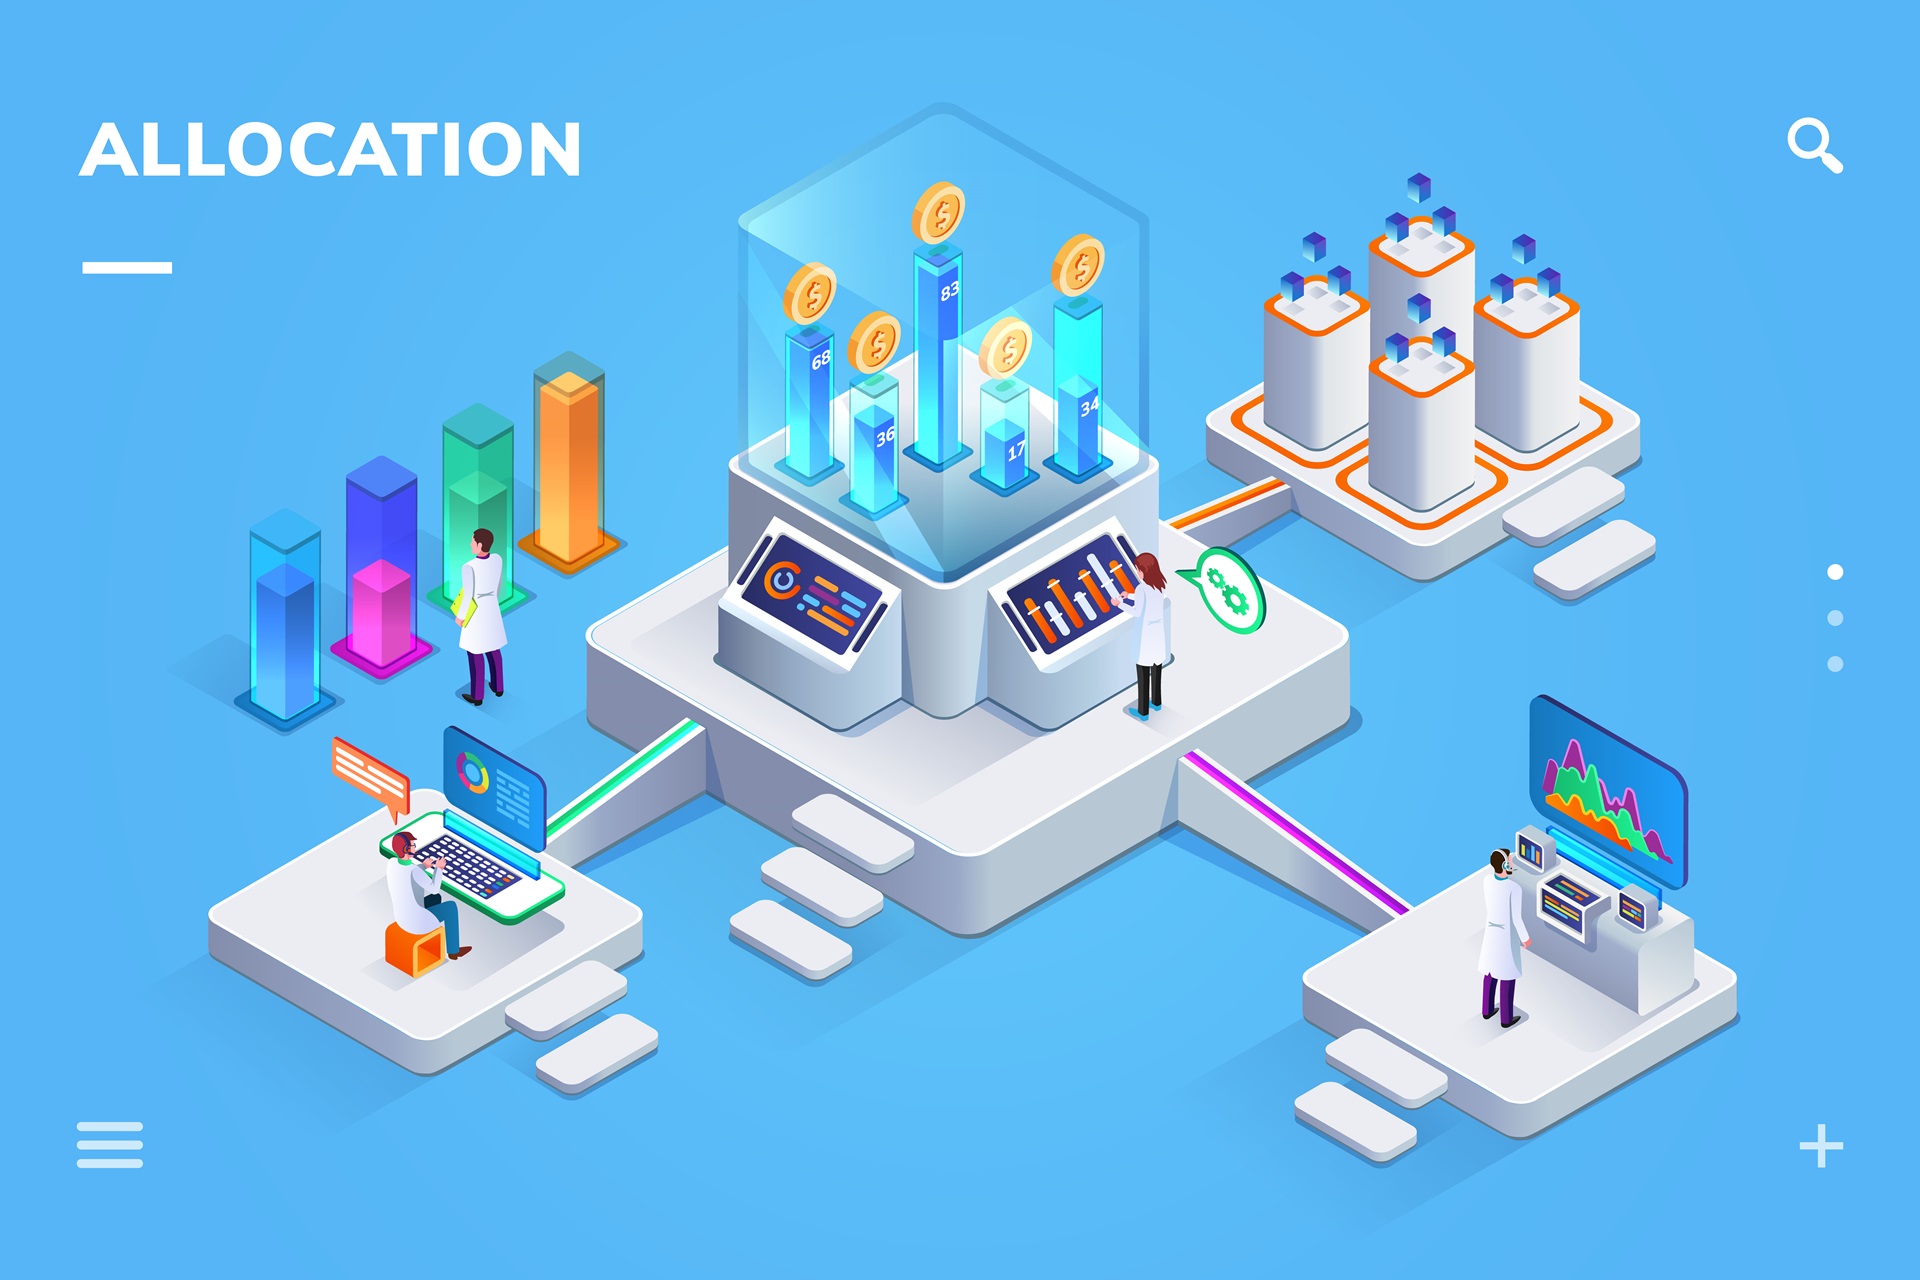
Best Practices for Setting Up Effective Performance Monitoring
Implementing effective performance monitoring is crucial for maintaining the health and efficiency of any system. Start by identifying key metrics to track, such as page load times, server response rates, and user activity.
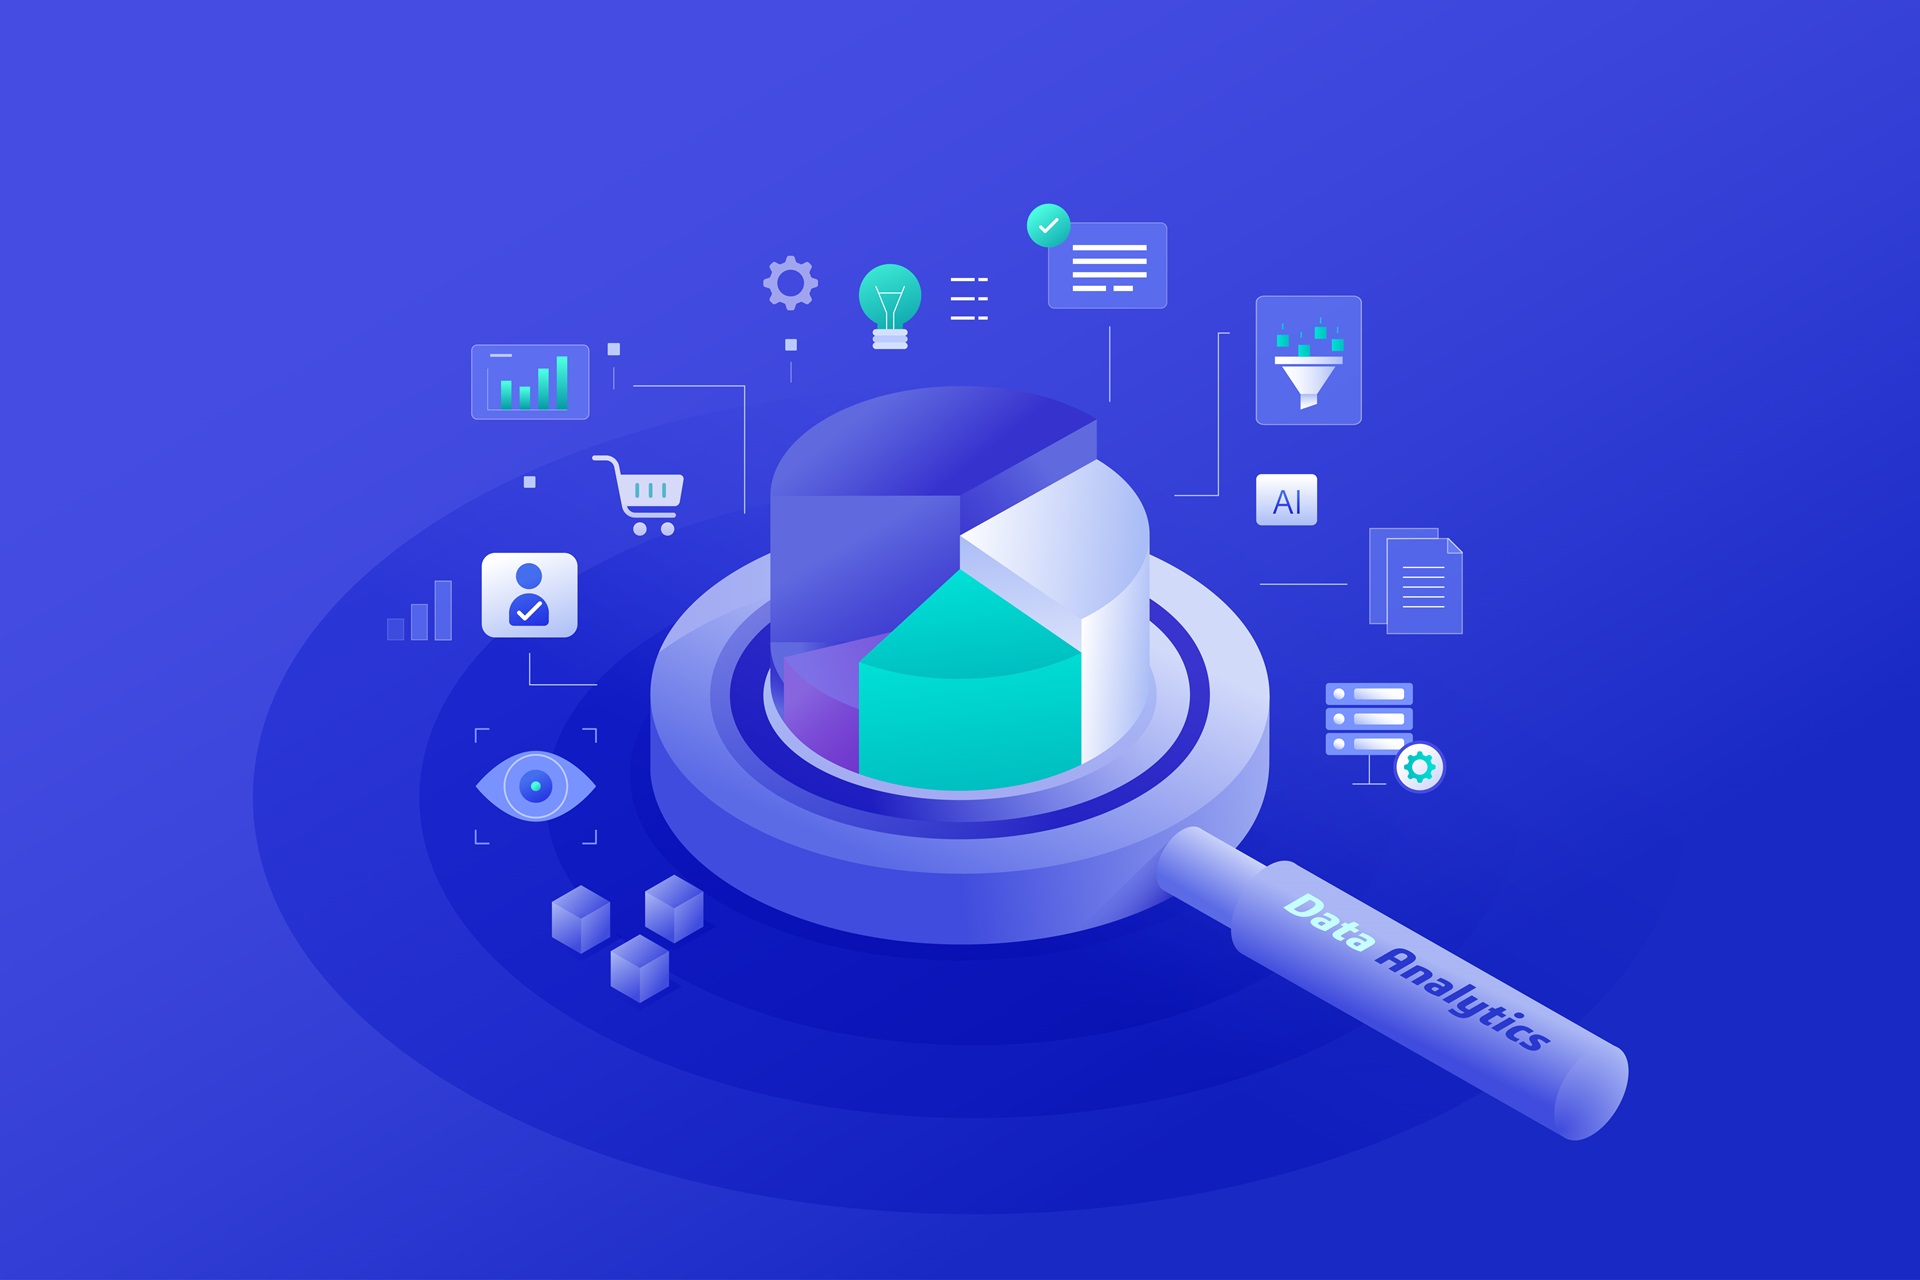
How Data Analytics Can Transform Your Business
Discover how data analytics drives business transformation by optimizing workflows, personalizing customer experiences, and boosting productivity. Explore real-world case studies and learn how predictive analytics helps.